
In this guide, we’ll tour the Prometheus Operator’s features and show how to get started. You’ll learn about Prometheus Operator’s benefits and how it improves on manual Prometheus deployment methods. Let’s get started.
We will cover:
What is the Prometheus Operator?
Prometheus Operator is a Kubernetes operator that automates the process of installing and configuring Prometheus, the leading time-series database for powering monitoring systems.
Using Prometheus Operator simplifies the Prometheus deployment experience when you’re working in Kubernetes environments. The operator provides a set of Custom Resource Definitions (CRDs) that allow you to easily configure your Prometheus installation with metrics sources, rules, and alerts.
Prometheus Operator provides a Kubernetes-native management experience for Prometheus instances deployed to a Kubernetes cluster. It automates the deployment of the Prometheus server and related components, generates metrics scraping target configurations based on Kubernetes labels, and lets you configure your installation using a set of provided CRDs.
The operator isn’t required to run Prometheus in Kubernetes—you can manually deploy Prometheus by writing your own Kubernetes manifest files that create the various resources required. However, this is a complex task which can require specialist knowledge.
Prometheus Operator does all the hard work for you. Because it lets you use CRDs to configure your environment, there’s no need to learn a Prometheus-specific config language. You can easily set up metrics targets for resources in your Kubernetes cluster, even if you’ve never used Prometheus before.
What is the difference between Prometheus and Prometheus Operator?
Prometheus is an open-source time-series database. It provides a powerful model for storing, querying, and visualizing time-series data such as event streams and metrics logs, making it an ideal solution for monitoring and observability suites. Prometheus can be deployed in many different ways, including as a precompiled binary, from source, or in a container.
Prometheus Operator is a Kubernetes operator implementation that wraps Prometheus with a Kubernetes-specific deployment and configuration model. The operator is purpose-built to make it easier to run and use Prometheus with Kubernetes. Prometheus Operator isn’t applicable to any other kind of environment.
What is the difference between Prometheus Operator and Prometheus Adapter?
As mentioned above, Prometheus Operator is a mechanism for deploying and configuring Prometheus in Kubernetes. The Prometheus Adapter project is an implementation of the Kubernetes metrics APIs that works with Prometheus. It provides metrics from your Prometheus instance back to your Kubernetes cluster’s control plane.
Prometheus Adapter is commonly used to make Kubernetes autoscaling decisions based on arbitrary metrics available in your Prometheus instance. By default, Kubernetes only supports CPU and memory usage metrics, but installing Prometheus Adapter allows you to autoscale in response to custom metrics stored in Prometheus.
Prometheus Operator and Prometheus Adapter are independent projects that do not depend on each other. You don’t need to install Prometheus Adapter unless you want Prometheus metrics to be exposed to the Kubernetes metrics APIs. Conversely, if you’re already running a Prometheus instance outside your cluster, you can use Prometheus Adapter without Prometheus Operator.
Prometheus Operator use cases and benefits
Prometheus Operator is suitable for any use case where you need to run Prometheus inside a Kubernetes cluster.
Using the operator instead of a manual deployment method provides several tangible advantages:
1. Simplicity
You can deploy Prometheus in just a few minutes using the Operator’s predefined manifest files. Once installed, you can configure Prometheus via the operator’s built-in CRDs, without having to learn any Prometheus-specific languages.
2. Scalability
Deployments created by the Operator are scalable and support seamless dynamic updates. There’s no downtime when you change your configuration.
3. Kubernetes-native
The Operator offers a first-class experience for running Prometheus in Kubernetes. The Prometheus instance is fully integrated with your Kubernetes cluster.
4. Automatic monitor target discovery
The Operator can automatically discover labelled resources in your Kubernetes cluster and generate Prometheus scraping configs. When a new labelled Pod is created, for example, its metrics will automatically show up in Prometheus.
5. Easy Prometheus configuration using Kubernetes CRDs
All Prometheus components are supported as CRDs including metrics target configurations and Alertmanager rules. You can modify Prometheus behavior by creating, editing, and deleting instances of these CRDs, without directly editing any Prometheus config files.
6. Complete monitoring stack
Prometheus Operator provisions a full observability stack, including Alertmanager to send notifications when metrics change, and Grafana to create visual metrics dashboards.
These powerful features make the Operator the best way to run Prometheus in Kubernetes.
Prometheus Operator Custom Resource Definitions (CRDs)
The Prometheus Operator’s CRDs are one of its most useful features. These CRDs are how you configure your Prometheus instance so it’s important to understand what they do. At the time of writing, Prometheus Operator adds 10 CRDs to your cluster:
Prometheus– Defines the configuration of the main Prometheus server deployment, including storage and replication options.PrometheusAgent– Defines a Prometheus deployment that runs in Agent mode to forward events to another server.Alertmanager– Configures Alertmanager, the Prometheus component that’s responsible for distributing alerts to your connected chat apps, webhooks, and other notification endpoints.ThanosRuler– Configures Thanos Ruler, the component that evaluates Prometheus alerting and recording rules.ServiceMonitor– Defines a Prometheus target that scrapes metrics from a Kubernetes Service.PodMonitor– Defines a Prometheus target that scrapes metrics from a set of Kubernetes Pods.Probe– Provides configuration that describes how static targets and Ingress groups should be scraped.ScrapeConfig– Defines a custom metrics scraping configuration to register with Kubernetes. Whereas ServiceMonitor, PodMonitor, and Probe scrape Kubernetes resources inside your cluster, ScrapeConfig is often used to monitor external resources.PrometheusRule– Configures alerting and recording rules to apply to your Prometheus instance.AlertmanagerConfig– Specifies alert routing and receiver options for Alertmanager.
Collectively, these CRDs allow you to manage every aspect of your Prometheus installation, without touching any config files yourself. Prometheus Operator will automatically regenerate and reload your configuration each time your CRD instances change.
How to use Prometheus Operator
Now let’s get started with Prometheus Operator in a real cluster. We’ll install the Operator, access the Prometheus dashboard and Grafana, then show how to use some of the available CRDs to configure a monitor and alert receiver.
You’ll need Kubectl and Helm installed with an active connection to a Kubernetes cluster.
How to install Prometheus Operator?
You can install Prometheus Operator by following the quick start steps in its documentation. However, this requires some manual steps to create a namespace, install the operator’s CRDs, and apply its Kubernetes manifest files.
For this guide, we’ll use the community-maintained kube-prometheus-stack Helm chart instead. It allows you to deploy the operator and related components using Helm, simplifying installation and future upgrades. The Helm chart also configures some default monitoring targets for the resources in your Kubernetes cluster.
1. Register the Helm chart repository in your client
To begin, first, register the chart’s repository in your Helm client:
$ helm repo add prometheus-community https://prometheus-community.github.io/helm-charts
"prometheus-community" has been added to your repositories
Update your repositories so Helm discovers the chart:
$ helm repo update2. Deploy the chart into the kube-prometheus-stack namespace
Next, run the following command to deploy the chart into the kube-prometheus-stack namespace in your cluster. This will install Prometheus Operator, Grafana, and all dependencies.
$ helm install kube-prometheus-stack \
  --create-namespace \
  --namespace kube-prometheus-stack \
  prometheus-community/kube-prometheus-stack
NAME: kube-prometheus-stack
LAST DEPLOYED: Wed Sep 20 09:25:30 2023
NAMESPACE: kube-prometheus-stack
STATUS: deployed
REVISION: 1
NOTES:
kube-prometheus-stack has been installed. Check its status by running:
  kubectl --namespace kube-prometheus-stack get pods -l "release=kube-prometheus-stack"
3. Run Kubectl’s get pods
Use Kubectl’s get pods command to inspect the Pods created by the Operator.
Wait until they all show as Running before you continue—this might take several minutes while your cluster pulls the required container images and starts the Pods.
$ kubectl get pods -n kube-prometheus-stack
NAME                                                        READY   STATUS    RESTARTS   AGE
alertmanager-kube-prometheus-stack-alertmanager-0           2/2     Running   0          79s
kube-prometheus-stack-grafana-56b76d89cb-44z55              3/3     Running   0          93s
kube-prometheus-stack-kube-state-metrics-599db949d7-stlbh   1/1     Running   0          93s
kube-prometheus-stack-operator-66b485d695-r22pv             1/1     Running   0          93s
kube-prometheus-stack-prometheus-node-exporter-pkp55        1/1     Running   0          93s
prometheus-kube-prometheus-stack-prometheus-0               2/2     Running   0          79s
Log into Prometheus
Now that Prometheus is running, you can connect to its web interface to start querying the automatically scraped metrics. The web UI isn’t exposed by default—to access it, you can start a Kubectl port forwarding session:
$ kubectl port-forward -n kube-prometheus-stack svc/kube-prometheus-stack-prometheus 9090:9090
Forwarding from 127.0.0.1:9090 -> 9090
Forwarding from [::1]:9090 -> 9090
This redirects your local port 9090 to the Prometheus service running in your cluster.
Now you can visit http://localhost:9090 in your web browser to load the Prometheus UI:
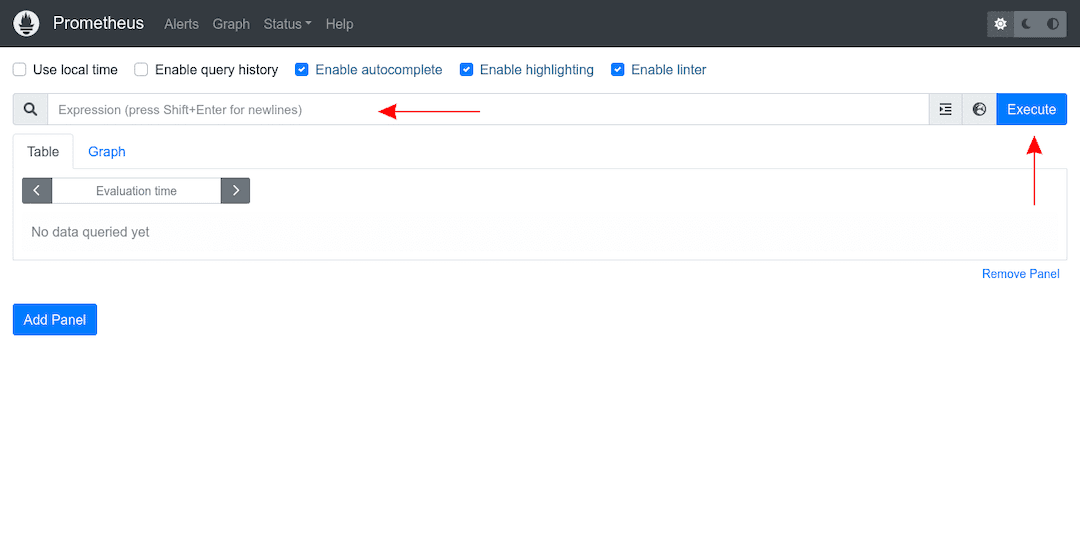
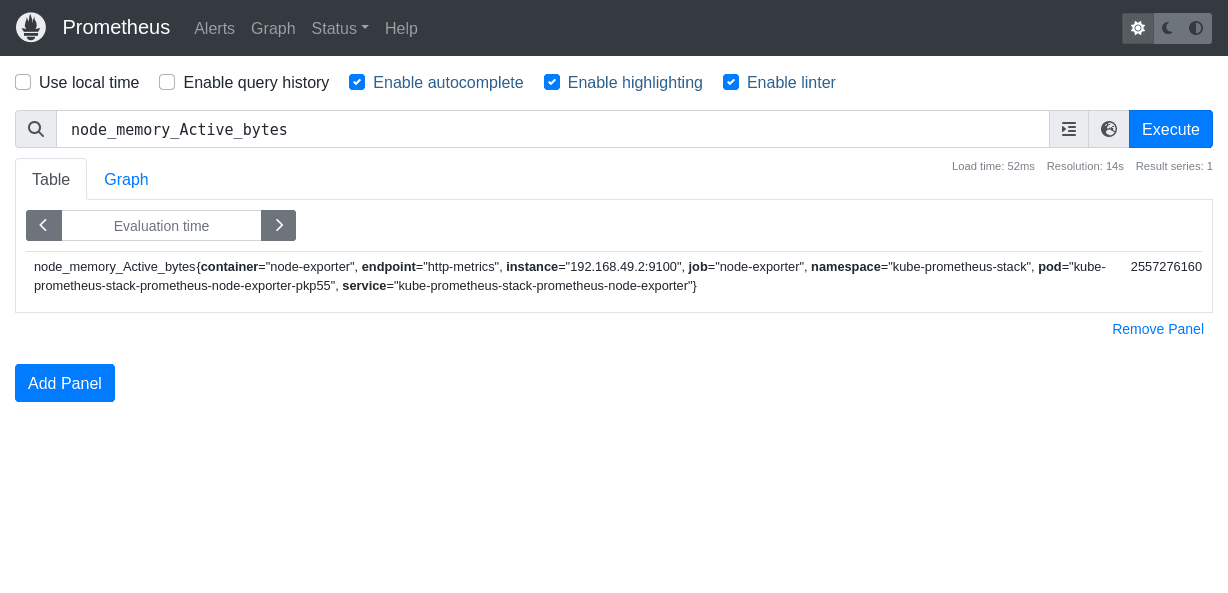
Try running a simple metrics query by typing into the Expression input at the top of the screen. The node_memory_Active_bytes metric will provide the current memory consumption of the Nodes in your cluster, for example.
Log into Grafana
Deploying the Prometheus Operator via the kube-prometheus-stack Helm chart means you also get a Grafana instance that you can use to create dashboards of your metrics.
You can connect to Grafana by starting a port-forwarding session to the kube-prometheus-stack-grafana service:
$ kubectl port-forward -n kube-prometheus-stack svc/kube-prometheus-stack-grafana 8080:80
Forwarding from 127.0.0.1:8080 -> 3000
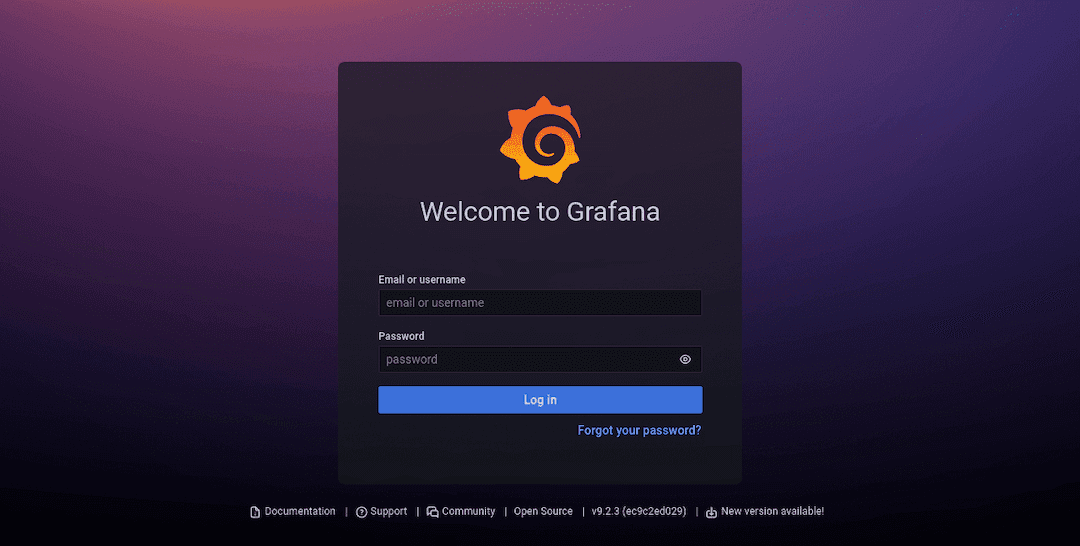
Forwarding from [::1]:8080 -> 3000Requests to your local port 8080 will now be directed to the Grafana service running in your cluster. Login to Grafana by visiting http://localhost:8080 in your browser and using admin/prom-operator as your credentials.
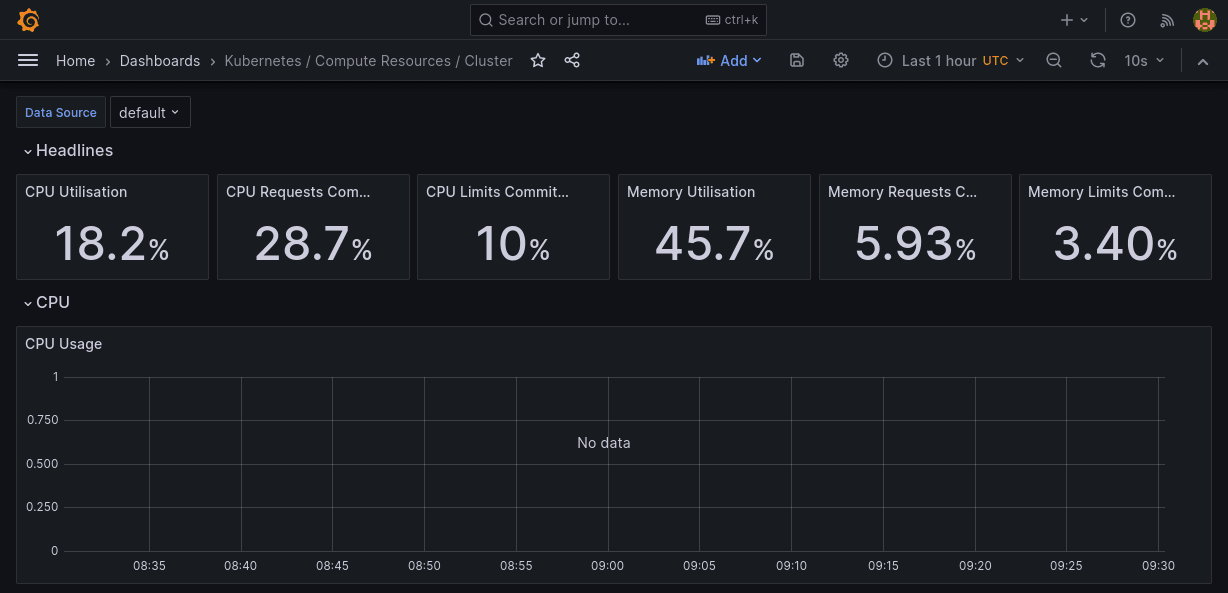
You can explore the preconfigured dashboards by clicking the menu button in the top-left, then selecting “Dashboards” from the menu. The General > Kubernetes / Compute Resources / Cluster dashboard provides an overview of your cluster’s physical resource utilization, for example.
How to set up ServiceMonitor and metrics sources
With the Prometheus Operator installed, you can start to create custom metrics sources that allow you to monitor your own applications. Let’s create a simple demo app to test this out.
1. Set up your project
Create a directory for your project, then copy the following code and save it as main.js:
const express = require("express");
const prometheus = require("prom-client");
const app = express();
const counter = new prometheus.Counter({
name: "TotalRequests",
help: "Total requests made to the service",
labelNames: ["uri"]
});
const counterMiddleware = (req, res, next) => {
if (req.path !== "/prometheus") {
counter.inc({uri: req.path});
}
next();
};
app.use(counterMiddleware);
app.get("/prometheus", (req, res) => {
res.set("Content-Type", prometheus.register.contentType);
prometheus.register.metrics().then(metrics => res.send(metrics));
});
app.get("*", (req, res) => res.send("Spacelift Prometheus demo app"));
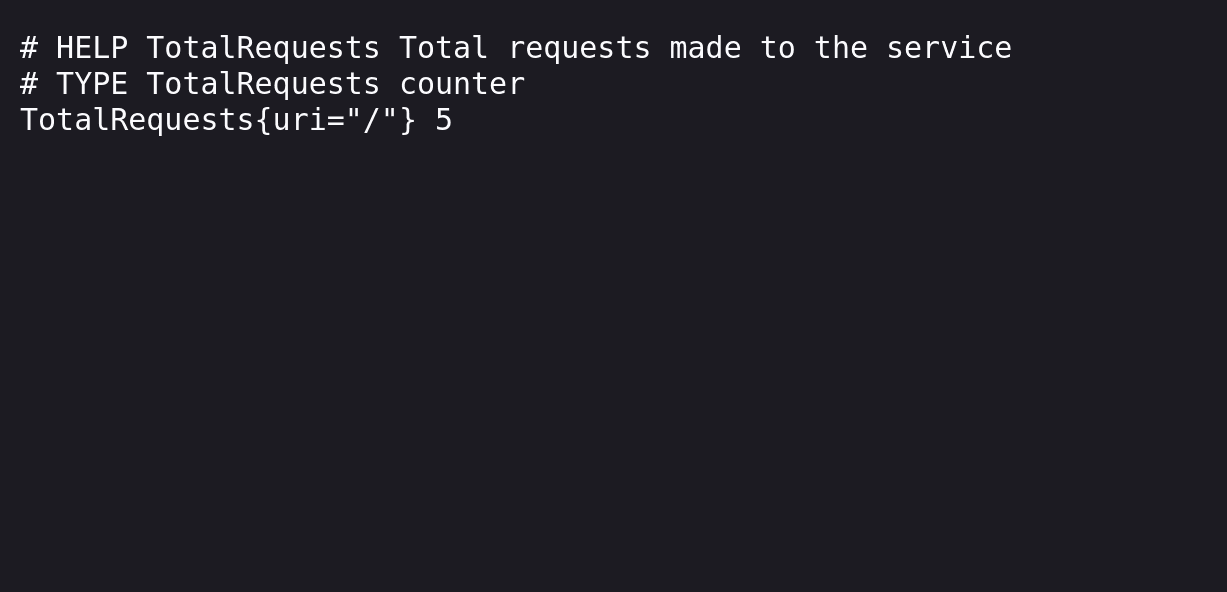
app.listen(80, () => console.log("Ready"));This code creates a Node.js application that exposes an Express web server. Each time you make a request to the server, it will increase the value of the TotalRequests Prometheus metric. A different counter is maintained for each URI you visit.
The service exposes the metric’s values in Prometheus format at its /prometheus endpoint. We’ll configure Prometheus to scrape this endpoint to retrieve the service’s metrics.
Next, use npm to install the project’s dependencies:
$ npm install express prom-clientAfterwards, create a Dockerfile for your project:
FROM node:18
WORKDIR /app

COPY *.json ./
RUN npm ci

COPY *.js ./

ENTRYPOINT ["node", "main.js"]
Finally, build your Docker image and push the result to your Docker Hub account. This will allow you to use the image in your Kubernetes cluster in the next steps.
$ docker build -t $docker_hub_username/spacelift-prometheus-demo-app:latest .
$ docker push $docker_hub_username/spacelift-prometheus-demo-app:latest
2. Deploy your app to Kubernetes
Next, create a Kubernetes manifest that includes a Deployment and Service for your app.
Copy the following example and save it to spacelift-prometheus-demo.yaml.
apiVersion: apps/v1
kind: Deployment
metadata:
  name: spacelift-prometheus-demo
spec:
  replicas: 1
  selector:
    matchLabels:
      app: spacelift-prometheus-demo
  template:
    metadata:
      labels:
        app: spacelift-prometheus-demo
    spec:
      containers:
        - name: app
          image: $docker_hub_username/spacelift-prometheus-demo-app:latest
          ports:
            - name: http
              containerPort: 80

---

apiVersion: v1
kind: Service
metadata:
  name: spacelift-prometheus-demo
  labels:
    app: spacelift-prometheus-demo
spec:
  selector:
    app: spacelift-prometheus-demo
  ports:
    - name: http
      port: 80
Use Kubectl to apply your manifest and deploy your app:
$ kubectl apply -f spacelift-prometheus-demo.yaml
deployment.apps/spacelift-prometheus-demo created
service/spacelift-prometheus-demo created
Next, open a port forwarding session to the app’s service:
$ kubectl port-forward svc/spacelift-prometheus-demo 8000:80
Forwarding 127.0.0.1:8000 -> 80
Forwarding [::1]:8000 -> 80
Finally, visit http://localhost:8000 in your browser and refresh the page a few times. This will increment the value of your Prometheus counter. You can visit http://localhost:8000/prometheus to see the current Prometheus data.
3. Create a Prometheus Operator ServiceMonitor
With your app deployed, you can create a ServiceMonitor to connect your metrics to Prometheus. ServiceMonitor is a CRD provided by the Prometheus Operator. It allows you to declaratively configure Kubernetes services as Prometheus metrics scraping targets.
Copy the following YAML manifest, then save it to spacelift-prometheus-servicemonitor.yaml:
apiVersion: monitoring.coreos.com/v1
kind: ServiceMonitor
metadata:
  name: spacelift-prometheus-servicemonitor
  labels:
    release: kube-prometheus-stack
spec:
  endpoints:
    - port: http
      path: /prometheus
      interval: 15s
  selector:
    matchLabels:
      app: spacelift-prometheus-demo
This ServiceMonitor configures Prometheus to scrape the /prometheus endpoint of services with an app=spacelift-prometheus-demo label. The service we created above included this label so it will be matched by the ServiceMonitor’s selector. The spec.endpoints.interval field means the metrics will be collected every 15 seconds.
The release: kube-prometheus-stack label is required for the Prometheus Operator to correctly discover the ServiceMonitor.
Use Kubectl to add the ServiceMonitor to your cluster:
$ kubectl apply -f spacelift-prometheus-servicemonitor.yaml
servicemonitor.monitoring.coreos.com/spacelift-prometheus-servicemonitor created
The Prometheus Operator will automatically detect the new ServiceMonitor resource. It will reconfigure your Prometheus instance to include the scrape configuration. Wait a few moments to allow time for this to happen.
4. Query your metric in the Prometheus UI
Now that you’ve created your ServiceMonitor, you can return to the Prometheus UI to query your app’s metrics.
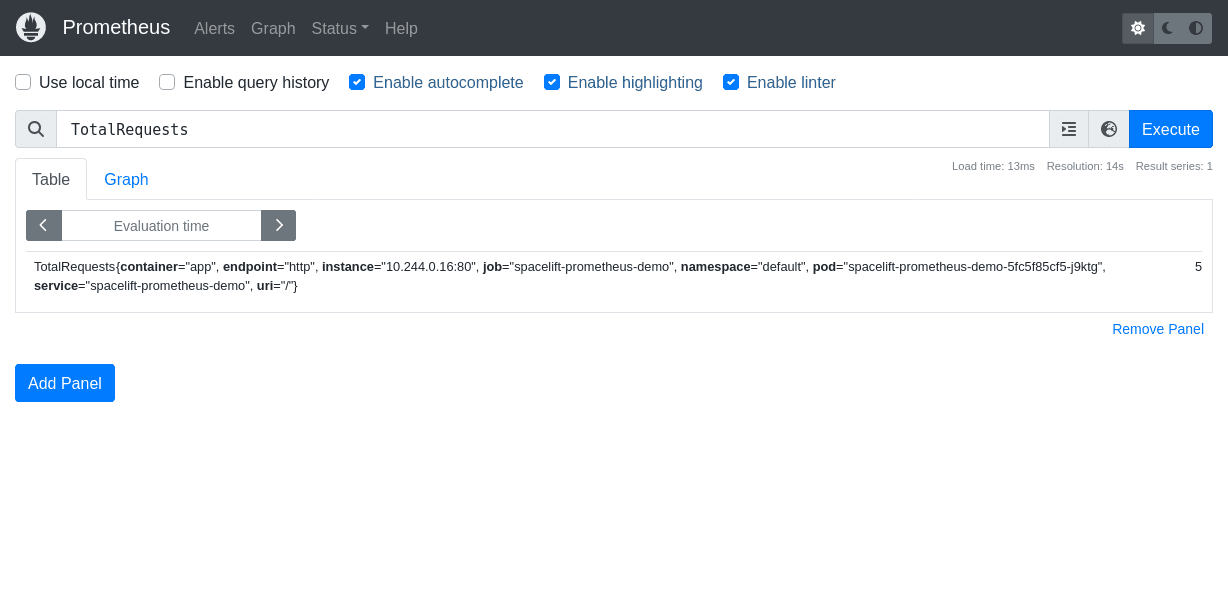
Use the Expression input at the top of the screen to search for your TotalRequests metric.
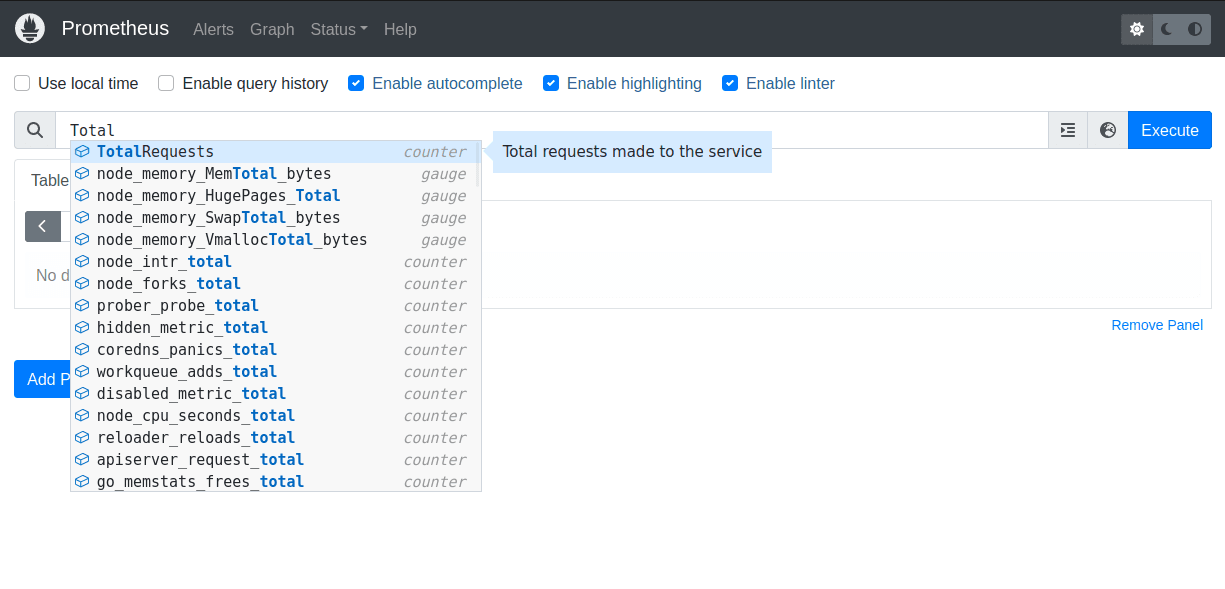
When you press the “Execute” button, you’ll see the metrics that have been collected from your application by the ServiceMonitor.
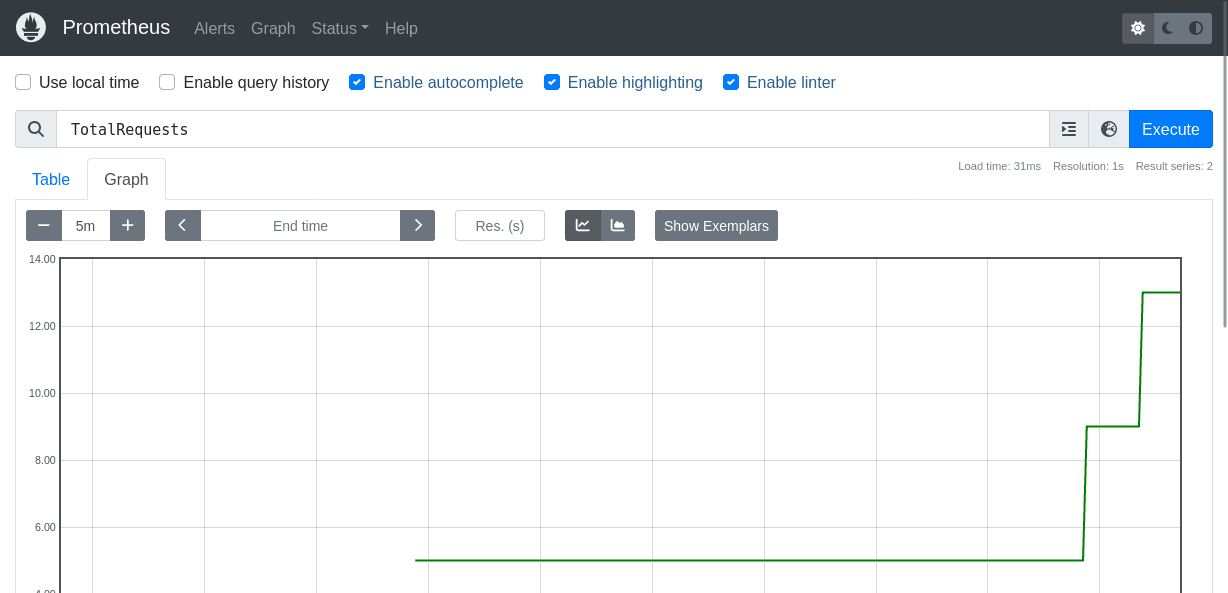
You can switch to the Graph tab to quickly visualize how the counter’s value has changed.
5. Use your metric in a Grafana Dashboard panel
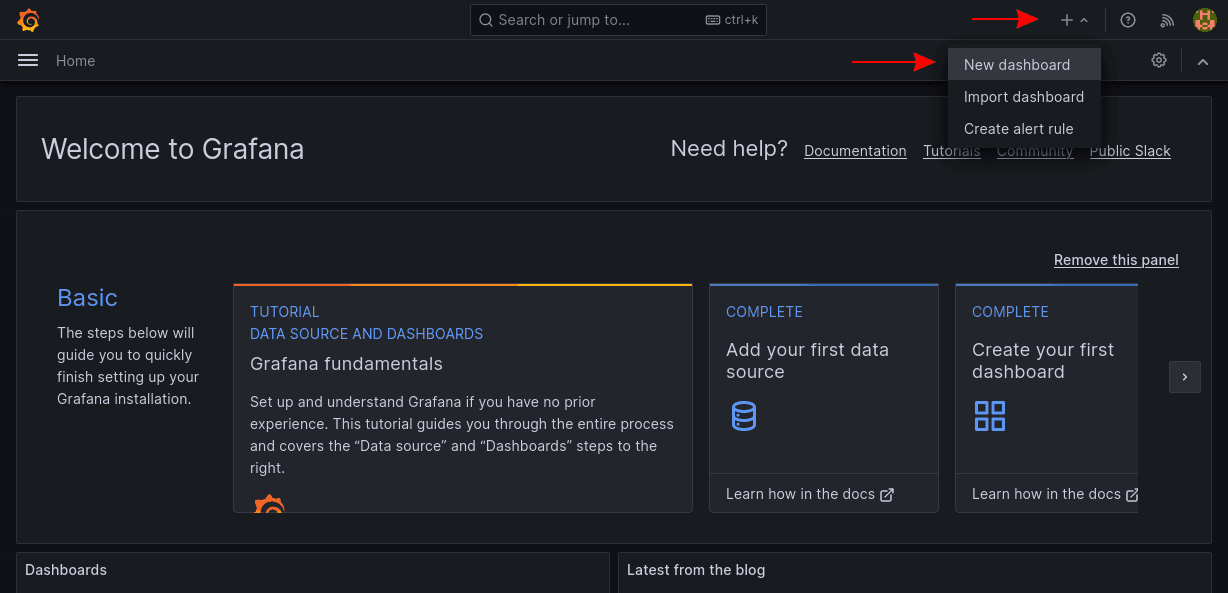
Grafana is a more powerful way to visualize metrics on custom dashboards. To create a dashboard for your application, click the “+” button in the toolbar, then choose “New dashboard” in the menu.
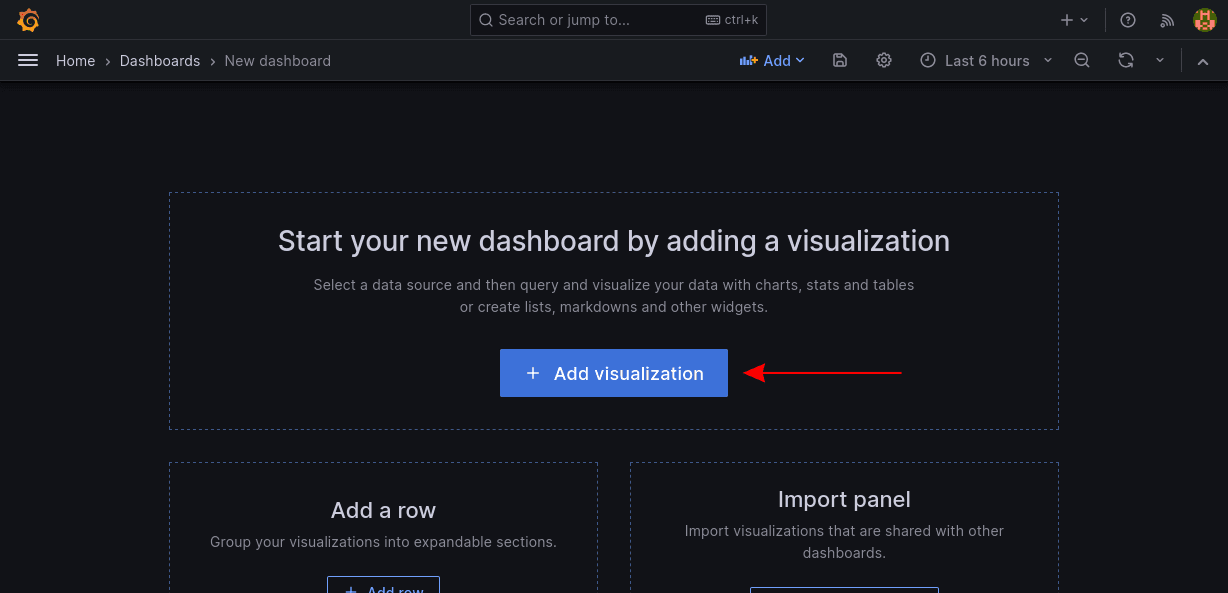
Press the blue “Add visualization” button:
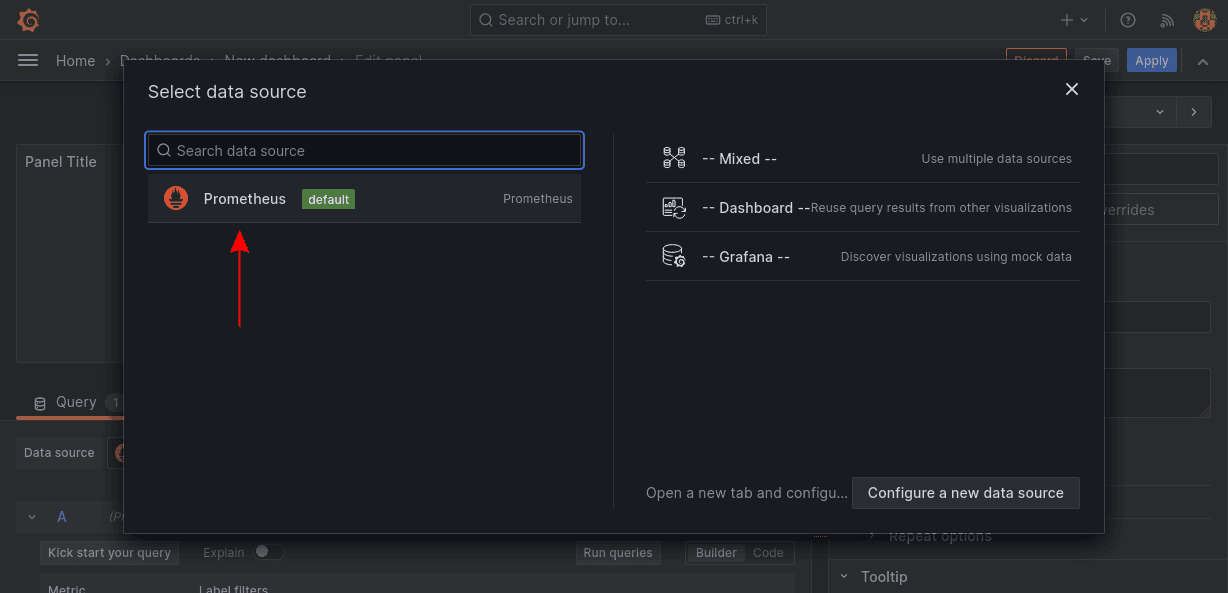
Select the Prometheus data source:
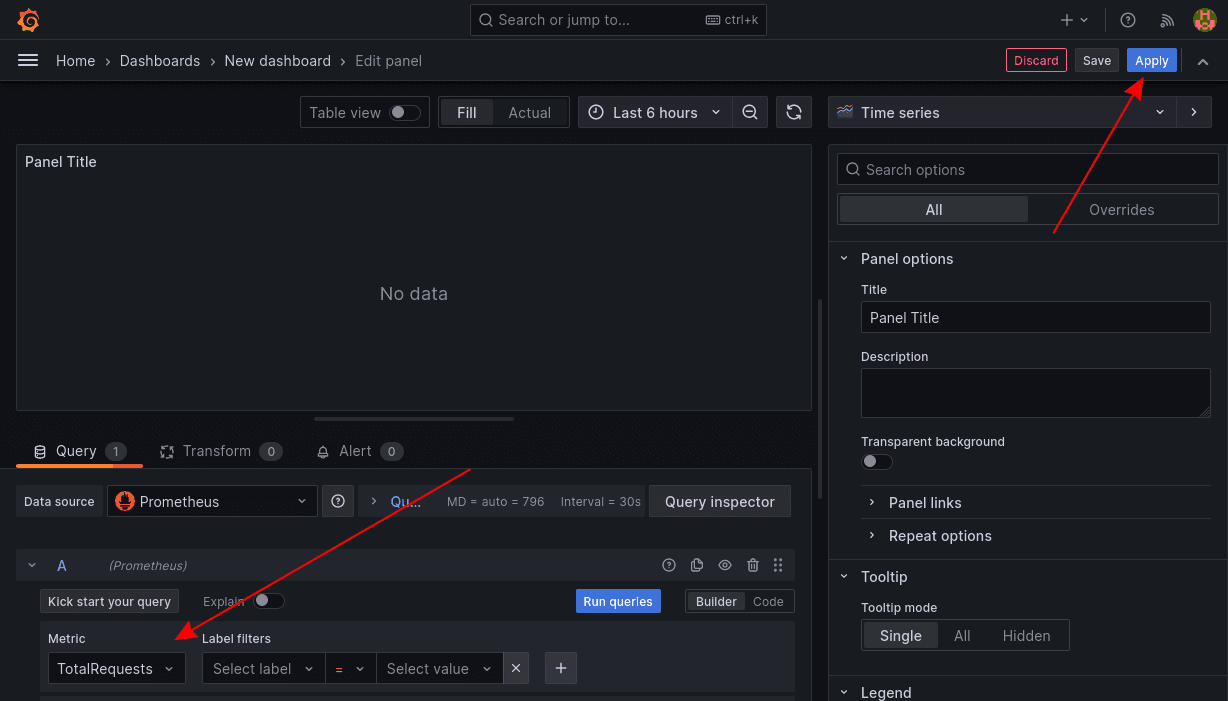
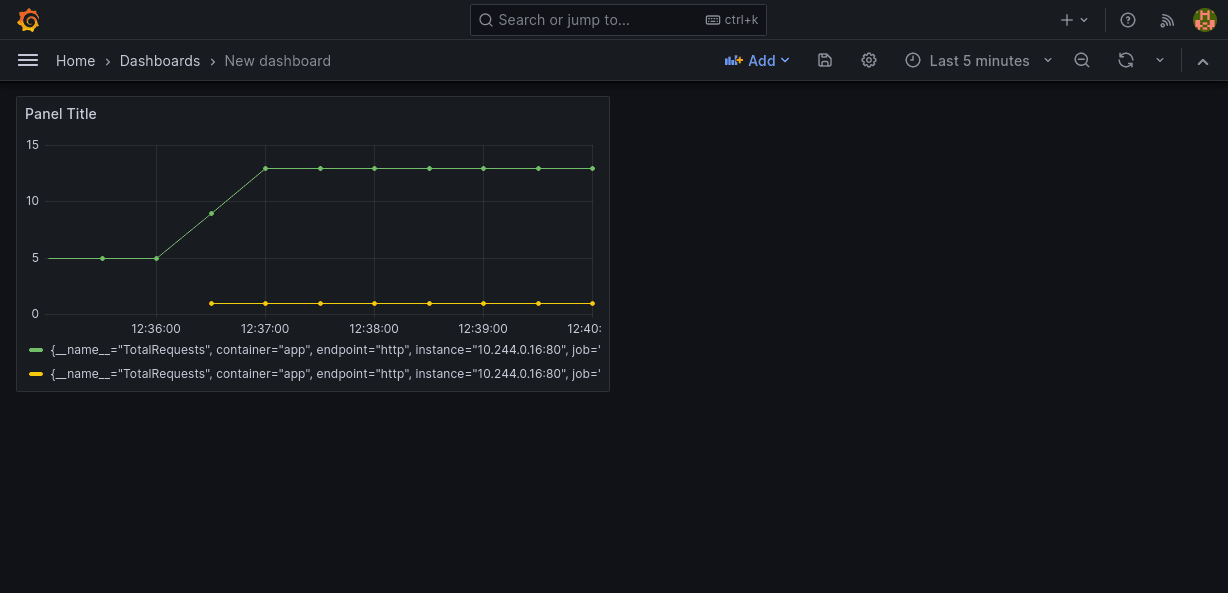
On the next screen, search for your TotalRequests metric in the “Select metric” dropdown within the query builder at the bottom of the screen. Then click “Apply” in the top-right to create your dashboard.
Now you can view your metrics values as a dashboard panel in Grafana.
What About PodMonitor?
In this example, we’ve used ServiceMonitor to scrape the application’s metrics. This is the correct choice when you already have a Kubernetes service for the Pods you need to scrape. The PodMonitor CRD can be used instead if you must scrape Pods directly, without using a service.
This should generally be avoided because multiple Pods are best placed behind a service to maintain scalability. Without a service, Kubernetes can’t distribute network traffic between your Pods. Nonetheless, PodMonitor can be useful to collect metrics from one-off Pods that expose a Prometheus endpoint, but shouldn’t become services in your cluster. This could include Pods that perform sidecar functions and Pods that are created by Jobs or CronJobs, for example.
How to enable Alerts in Prometheus
Prometheus Operator supports Alertmanager notifications to chat apps, webhooks, email, and other receiver endpoints. Alerts are sent as your metrics change.
You can configure Alertmanager by creating instances of the AlertmanagerConfig CRD. The following example configures AlertManager to send alerts to the http://example.com/webhook webhook:
apiVersion: monitoring.coreos.com/v1alpha1
kind: AlertmanagerConfig
metadata:
  name: spacelift-alertmanager-config
spec:
  route:
    receiver: webhook-receiver
    groupWait: 5s
    groupInterval: 10s
    repeatInterval: 1m
  receivers:
    - name: webhook-receiver
      webhookConfigs:
        - url: http://example.com/webhook
          sendResolved: true
You’ll now receive alerts to your webhook when alerts fire in Prometheus.
To send a test alert, first start a port-forwarding session to the Alertmanager instance in your cluster—it listens on port 9093:
$ kubectl port-forward -n kube-prometheus-stack svc/kube-prometheus-stack-alertmanager 9093:9093You can then make a request to the Alertmanager API to simulate an alert from a specific Kubernetes service:
$ curl -H 'Content-Type: application/json' -d \
'[{"labels":{"alertname":"spacelift-demo-alert","namespace":"spacelift-demo","service":"spacelift-demo-alert-service"}}]' \
  http://127.0.0.1:9093/api/v1/alerts
{"status":"success"}
You can set up other alert receivers by following the guidance in the Alertmanager documentation.
Key points
Prometheus Operator automates the deployment and configuration of Prometheus installations in Kubernetes clusters. It lets you use Kubernetes CRDs to define your Prometheus metrics monitors, rules, and alerts.
In this article, we’ve explored how Prometheus Operator works, shown how to deploy it with the Kube Prometheus Stack Helm chart, and provided a guide to getting started with some of the operator’s CRDs. Using the Prometheus Operator to run Prometheus in Kubernetes is simpler, more scalable, and easier to maintain than manually deployed Prometheus instances.
Looking for more guides for Prometheus and Kubernetes? Check out our other recent content, here on the Spacelift blog!
Need an even simpler way to manage CI/CD pipelines on Kubernetes? Check out how Spacelift can help you cut down complexity and automate your infrastructure. It’s even got a Prometheus exporter ready to deliver metrics from your Spacelift account to your Grafana dashboards and other tools! Learn more with our tutorial on Monitoring Your Spacelift Account via Prometheus.
Manage Kubernetes Easier and Faster
Spacelift allows you to automate, audit, secure, and continuously deliver your infrastructure. It helps overcome common state management issues and adds several must-have features for infrastructure management.
Frequently asked questions
What are the requirements for the Prometheus operator?
The Prometheus Operator requires a running Kubernetes cluster with CustomResourceDefinition (CRD) support and sufficient RBAC permissions to manage monitoring components.
