
Ansible automates infrastructure and application management at scale using playbooks, ensuring consistency through idempotent execution. However, untested playbooks can cause significant issues, so quick debugging is crucial in production.
Ansible provides effective debugging tools, including modules and commands to inspect variables and task execution. The debug module is commonly used to print variable values and messages, helping identify and resolve issues efficiently.
In this blog, we’ll explore various debugging techniques in Ansible using practical examples, CLI commands, relevant environment variables, and steps to follow an effective debugging process.
- Ansible CLI commands for troubleshooting playbooks
- How to debug Ansible environment variables
- How to use the Ansible debug module
- How to use verbosity control flags in Ansible
- Conditional debugging in Ansible
- Assertion and validation in Ansible
- Interactive troubleshooting in Ansible
- How to log Ansible debug information
Ansible CLI commands for troubleshooting playbooks
The ansible-playbook CLI tool offers many debugging commands. These commands allow users to gain insights into the execution of playbook tasks and identify issues.
Here, we will discuss the most popular commands for systematic inspection, analysis, and troubleshooting of playbooks.
1. Verbose output (-v to -vvvv)
One of the most effective ways to debug Ansible playbooks is by increasing verbosity levels. By adding -v, you can see additional details about the tasks being executed. You can also increase the verbosity level by adding more ‘v’s in the command.
-v: Displays basic debugging information, such as task names and results-vv: Includes more detailed outputs, like variable values-vvv: Shows additional debugging data, such as task-level operations-vvvv: Enables connection debugging, providing a deep dive into network communication
2. Check mode (dry run)
The --check option (aka dry run) allows us to preview playbook changes without actually applying them. This is useful for testing a playbook’s potential impact.
ansible-playbook playbook.yml --check: Runs the playbook in check mode.-C: A shorter form for the same functionality.
3. Diff mode (show changes)
The --diff option is very valuable for tasks that modify files or configurations. It displays a side-by-side comparison of changes that would be applied if the Ansible playbook were executed.
ansible-playbook playbook.yml --diff: Displays detailed diffs for file-related tasks-D: A shorthand version of the same command
4. Start at a specific task
When debugging large playbooks, restarting the entire execution becomes time-consuming. The --start-at-task option allows us to begin execution from a specific task.
ansible-playbook playbook.yml --start-at-task="Task Name": Skips all tasks prior to the specified one
5. Step through tasks
The --step option lets us execute playbooks interactively, stepping through one task at a time. This is particularly useful for pinpointing issues:
ansible-playbook playbook.yml --step: Prompts you before running each task
6. Check syntax only
Use the --syntax-check option to quickly validate the syntax of your Ansible playbook without running it. This ensures there are no structural errors before execution.
ansible-playbook playbook.yml --syntax-check: Checks the YAML syntax and reports any issues
When used strategically, these commands streamline the debugging process, making it easier to identify and resolve issues in Ansible playbooks. By mastering them, you can resolve issues efficiently and ensure your automation workflows run seamlessly.
Read more: Ansible Cheat Sheet: CLI Commands and Basics
How to debug Ansible environment variables
Environment variables give you a powerful way to fine-tune Ansible’s behavior, especially when it comes to debugging. With the right settings, you can control the level of detail in logs, decide where those logs go, and even influence how tasks run — making troubleshooting far more efficient.
Below, we’ll explore some of the most helpful environment variables for debugging, many of which we’ll use in the sections ahead.
ANSIBLE_DEBUG
When set to True or 1, ANSIBLE_DEBUG variable makes Ansible print detailed debugging information about its internal operations. This is especially helpful when we want to investigate why something isn’t working.
Possible values of ANSIBLE_DEBUG:
Trueor1: Enable detailed debugging output.Falseor0(default): Keep things quiet unless there’s an error.
ANSIBLE_KEEP_REMOTE_FILES
By default, Ansible removes temporary files it creates on remote systems during task execution. If we set ANSIBLE_KEEP_REMOTE_FILES variable to True, those files are kept so we can inspect them to understand what happened in the Ansible run.
Possible values of ANSIBLE_KEEP_REMOTE_FILES:
True: Keep remote files after tasks run.False(default): Clean up temporary files.
ANSIBLE_LOG_PATH
ANSIBLE_LOG_PATH variable lets us define a file where Ansible saves logs. Instead of scrolling through our terminal, we can check the log file later for detailed information about what happened during execution.
Possible values of ANSIBLE_LOG_PATH:
- Any valid file path, e.g., /var/log/ansible_debug.log
- If not set, Ansible doesn’t save logs to a file.
ANSIBLE_STRATEGY
ANSIBLE_STRATEGY variable determines the execution strategy Ansible uses for running tasks. The default is “linear”, where tasks are executed one at a time. The “free” strategy runs tasks in parallel whenever possible. The “debug” strategy is particularly useful for debugging. It pauses task execution after each step, letting us inspect the state and understand exactly what is happening before moving to the next task.
Possible values of ANSIBLE_STRATEGY:
linear(default): Runs tasks sequentially, one at a time.free: Allows tasks to run in parallel when dependencies permit.debug: Pauses execution after each task to enable step-by-step inspection.
These environment variables let us shape Ansible’s behavior to match our debugging needs. Whether it’s inspecting temporary files, analyzing logs, or adjusting task execution, they provide valuable control for troubleshooting. In the next sections, we’ll explore practical debugging techniques to help diagnose and resolve issues in Ansible playbooks effectively.
How to use the Ansible debug module
Debugging in Ansible often starts with understanding the flow of our playbooks and inspecting the values of variables or the output of specific tasks. The debug module is one of the simplest yet most powerful tools for this purpose. It allows us to print messages, variable values, or custom strings directly into the playbook output, helping us validate assumptions or identify issues in real-time.
The example below demonstrates how the debug module is used to print single and multi-line messages:
# Basic debug example
---
- name: Basic Ansible Debug Example
 hosts: localhost
 gather_facts: no
 tasks:
   - name: Print a simple message
     debug:
       msg: "Hello World! Welcome to Ansible Debug Module."

   - name: Print multiple messages
     debug:
       msg:
         - "Line 1: Basic message"
         - "Line 2: Another message"
The first task simply prints the debug message we set in the output, whereas the second task prints an array of messages, as we can see in the output below:
PLAY [Basic Ansible Debug Example] ***************************************************************

TASK [Print a simple message] ********************************************************************
ok: [localhost] => {
    "msg": "Hello World! Welcome to Ansible Debug Module."
}

TASK [Print multiple messages] *******************************************************************
ok: [localhost] => {
    "msg": [
        "Line 1: Basic message",
        "Line 2: Another message"
    ]
}

PLAY RECAP ***************************************************************************************
localhost                  : ok=2    changed=0    unreachable=0    failed=0    skipped=0    rescued=0    ignored=0
This demonstrates how we can print messages at different points in a playbook to gain insights into execution flow and confirm whether a task has run successfully. Additionally, printing variables allow us to inspect their values at specific stages, helping us identify unexpected changes or potential issues during execution.
Using the Ansible debug module when working with variables
Variables introduce flexibility to playbooks, helping reduce complexity. While debugging, it is crucial to understand how variables are set, accessed, and used.
The debug module can also be used to inspect variable values and confirm they are behaving as expected. By printing individual variables, composite messages, or even the entire set of variables, you can gain valuable insights into your playbook’s execution.
The example below shows how to work with variables and use the Ansible debug module for troubleshooting and validation.
# Working with variables
---
- name: Variable Debugging Examples
 hosts: localhost
 vars:
   greeting: "Hello"
   recipient: "World"
 tasks:
   - name: Print variable values
     debug:
       msg: "{{ greeting }}, {{ recipient }}!"

   - name: Print specific variable
     debug:
       var: greeting

   - name: Print all variables
     debug:
       var: hostvars[inventory_hostname]
In this playbook, we’ve defined two variables and used them in different ways to demonstrate their behavior.
The first task embeds both variables within a string using Jinja2 templates, ensuring they’re dynamically rendered in the output. The second task prints a single variable without templating, providing a direct comparison.
The "Print all variables" task takes this further by displaying every variable associated with the current host (localhost in this case). Using hostvars[inventory_hostname], we can access all variables available on the current Ansible host, including those defined in the playbook and default ones set by Ansible.
The output is a comprehensive dictionary of these variables, offering insight into the full execution context.
PLAY [Variable Debugging Examples] ************************************************************************************

TASK [Gathering Facts] ************************************************************************************************
ok: [localhost]

TASK [Print variable values] ******************************************************************************************
ok: [localhost] => {
    "msg": "Hello, World!"
}

TASK [Print specific variable] ****************************************************************************************
ok: [localhost] => {
    "greeting": "Hello"
}
TASK [Print all variables] ********************************************************************************************
.
.
.
},
        "ansible_virtualization_role": "",
        "ansible_virtualization_tech_guest": [],
        "ansible_virtualization_tech_host": [],
        "ansible_virtualization_type": "",
        "gather_subset": [
            "all"
        ],
        "group_names": [],
        "groups": {
            "all": [],
            "ungrouped": []
        },
        "inventory_hostname": "localhost",
        "inventory_hostname_short": "localhost",
        "module_setup": true,
        "omit": "__omit_place_holder__ca8677ac7e6c5366dfbb83ea2402b2bd687a16dd",
        "playbook_dir": "/Users/ldt/Documents/02_LDT/01_GlogExamples/ansible-debug"
    }
}

PLAY RECAP ************************************************************************************************************
localhost                  : ok=4    changed=0    unreachable=0    failed=0    skipped=0    rescued=0    ignored=0
This helps ensure variables are being set correctly, especially if they’re dynamic or passed from other sources like inventory files. Printing all variables gives a complete picture of the context Ansible is working in for a given host.
By leveraging the debug module to inspect variables, we can quickly pinpoint issues and confirm that our playbooks are operating as intended. This practice is especially helpful when working with complex variable hierarchies or dynamic data.
Register and shell command debugging
When debugging tasks that execute shell commands in Ansible, it is essential to capture and analyze the command’s output. The register parameter stores the command’s result, allowing us to inspect it later. Using the debug module, we can review the output and verify that the task behaves as expected.
The example below shows how to use register with a shell command and then print its output, helping us gain insights and troubleshoot any issues efficiently.
# Register and shell command debugging
---
- name: Register and Command Debug Examples
 hosts: localhost
 vars:
   uptime_command: "uptime"
 tasks:
   - name: Get system uptime
     shell: "{{ uptime_command }}"
     register: system_uptime

   - name: Print system uptime
     debug:
       msg: "The system has been up for: {{ system_uptime.stdout }}"

   - name: Print full command output
     debug:
       var: system_uptime
In this playbook, we first stored the command to run in a variable — the command to be run is “uptime”, which prints the system uptime-related information. It is stored in the uptime_command variable. We execute this command on the Ansible host machine to print its output.
The output of the first task — the output of executing the uptime command — is registered (stored) in the system_uptime register. Using the variable is not required; you can use it directly.
In the next task, Print system uptime, we print this output using the debug module in string format. The last task simply prints the raw output of system_uptime as it is, as seen in the output below:
PLAY [Register and Command Debug Examples] ****************************************************************************

TASK [Gathering Facts] ************************************************************************************************
ok: [localhost]

TASK [Get system uptime] **********************************************************************************************
changed: [localhost]

TASK [Print system uptime] ********************************************************************************************
ok: [localhost] => {
    "msg": "The system has been up for: 21:21  up 4 days,  9:38, 2 users, load averages: 1.84 1.91 2.06"
}

TASK [Print full command output] **************************************************************************************
ok: [localhost] => {
    "system_uptime": {
        "changed": true,
        "cmd": "uptime",
        "delta": "0:00:00.007907",
        "end": "2025-01-05 21:21:37.563312",
        "failed": false,
        "msg": "",
        "rc": 0,
        "start": "2025-01-05 21:21:37.555405",
        "stderr": "",
        "stderr_lines": [],
        "stdout": "21:21  up 4 days,  9:38, 2 users, load averages: 1.84 1.91 2.06",
        "stdout_lines": [
            "21:21  up 4 days,  9:38, 2 users, load averages: 1.84 1.91 2.06"
        ]
    }
}

PLAY RECAP ************************************************************************************************************
localhost                  : ok=4    changed=1    unreachable=0    failed=0    skipped=0    rescued=0    ignored=0
The register keyword captures a command’s output, allowing us to inspect it for success validation or troubleshooting. Printing this output helps confirm key system details, which is crucial for debugging.
Using debug with custom messages makes the playbook output clearer, benefiting both automation users and collaborators. By combining register, shell, and debug, we can track command execution effectively, ensuring we capture and interpret essential system data or task results. This method enhances visibility and control over Ansible operations.
How to use verbosity control flags in Ansible
Ansible provides verbosity flags to control the level of detail displayed during playbook execution. Adjusting verbosity helps tailor the output, whether you need a high-level summary or an in-depth view of task execution — especially useful for debugging complex playbooks.
In the example below, we show how the verbosity parameter in the debug module allows messages to appear only when a certain verbosity level is set. This ensures that essential details remain visible while preventing unnecessary clutter in standard output.
# Verbosity control
---
- name: Debug Verbosity Examples
 hosts: localhost
 tasks:
   - name: Always visible message
     debug:
       msg: "This message will always appear regardless of verbosity."

   - name: Verbose level 2 message
     debug:
       msg: "This message will only appear with -vv or higher verbosity."
       verbosity: 2

   - name: Verbose level 3 message
     debug:
       msg: "This message will only appear with -vvv or higher verbosity."
       verbosity: 3
For verbosity to take effect, we have to execute the playbooks by passing in verbosity flags (-v till -vvvv). When we don’t specify the verbosity level for a debug message, it is always printed to the terminal output, as seen for the first task in the output below:
ansible-playbook 04.yamlPLAY [Debug Verbosity Examples] ***************************************************************************************
TASK [Gathering Facts] ************************************************************************************************
ok: [localhost]
TASK [Always visible message] *****************************************************************************************
ok: [localhost] => {
"msg": "This message will always appear regardless of verbosity."
}
TASK [Verbose level 2 message] ****************************************************************************************
skipping: [localhost]
TASK [Verbose level 3 message] ****************************************************************************************
skipping: [localhost]
PLAY RECAP ************************************************************************************************************
localhost : ok=2 changed=0 unreachable=0 failed=0 skipped=2 rescued=0 ignored=0In the playbook’s second and third tasks, we’ve set verbosity levels to 2 and 3, respectively. These values correspond to the verbosity flags (-v, -vv, -vvv, etc.) used when running the playbook. If we execute it with -vv, Ansible will print both the default debug message and the "Verbose level 2 message" but will omit the "Verbose level 3 message".
However, when using -vvv or higher (-vvvv), all debug messages, including those at level 3, will be displayed.
The output below demonstrates the difference between running with -vv and -vvv, highlighting how verbosity settings influence what gets printed:
ansible-playbook 04.yaml -vvPLAYBOOK: 04.yaml *****************************************************************************************************
1 plays in 04.yaml
PLAY [Debug Verbosity Examples] ***************************************************************************************
TASK [Gathering Facts] ************************************************************************************************
task path: /Users/ldt/Documents/02_LDT/01_GlogExamples/ansible-debug/04.yaml:3
ok: [localhost]
TASK [Always visible message] *****************************************************************************************
task path: /Users/ldt/Documents/02_LDT/01_GlogExamples/ansible-debug/04.yaml:6
ok: [localhost] => {
"msg": "This message will always appear regardless of verbosity."
}
TASK [Verbose level 2 message] ****************************************************************************************
task path: /Users/ldt/Documents/02_LDT/01_GlogExamples/ansible-debug/04.yaml:10
ok: [localhost] => {
"msg": "This message will only appear with -vv or higher verbosity."
}
TASK [Verbose level 3 message] ****************************************************************************************
task path: /Users/ldt/Documents/02_LDT/01_GlogExamples/ansible-debug/04.yaml:15
skipping: [localhost] => {"skipped_reason": "Verbosity threshold not met."}
PLAY RECAP ************************************************************************************************************
localhost : ok=3 changed=0 unreachable=0 failed=0 skipped=1 rescued=0 ignored=0ansible-playbook 04.yaml -vvvPLAYBOOK: 04.yaml *****************************************************************************************************
1 plays in 04.yaml
PLAY [Debug Verbosity Examples] ***************************************************************************************
TASK [Gathering Facts] ************************************************************************************************
task path: /Users/ldt/Documents/02_LDT/01_GlogExamples/ansible-debug/04.yaml:3
<127.0.0.1> ESTABLISH LOCAL CONNECTION FOR USER: ldt
<127.0.0.1> EXEC /bin/sh -c 'echo ~ldt && sleep 0'
.
.
.
ok: [localhost]
TASK [Always visible message] *****************************************************************************************
task path: /Users/ldt/Documents/02_LDT/01_GlogExamples/ansible-debug/04.yaml:6
ok: [localhost] => {
"msg": "This message will always appear regardless of verbosity."
}
TASK [Verbose level 2 message] ****************************************************************************************
task path: /Users/ldt/Documents/02_LDT/01_GlogExamples/ansible-debug/04.yaml:10
ok: [localhost] => {
"msg": "This message will only appear with -vv or higher verbosity."
}
TASK [Verbose level 3 message] ****************************************************************************************
task path: /Users/ldt/Documents/02_LDT/01_GlogExamples/ansible-debug/04.yaml:15
ok: [localhost] => {
"msg": "This message will only appear with -vvv or higher verbosity."
}
PLAY RECAP ************************************************************************************************************
localhost : ok=4 changed=0 unreachable=0 failed=0 skipped=0 rescued=0 ignored=0Verbosity control in Ansible helps balance detailed insights with a clean, readable output. Higher verbosity levels reveal more granular information for debugging, whereas lower levels keep the output concise and focused.
This flexibility ensures that playbook execution remains manageable, showing only the necessary details based on the situation. By adjusting verbosity, we can fine-tune the debugging process, making it easier to troubleshoot issues without overwhelming the output.
Conditional debugging in Ansible
Conditional debugging in Ansible enables more targeted and efficient troubleshooting by controlling when debug messages appear, or specific actions execute. It is particularly useful for gathering debug data only when needed — such as when a certain environment variable is set or a task encounters an error.
Using when statements allows you to refine debugging output based on specific conditions, reducing noise and improving focus.
Let’s look at various ways we can apply conditions for debugging purposes in the example below.
# Conditional debugging
---
- name: Conditional Debug Examples
 hosts: localhost
 gather_facts: yes
 vars:
   debug_mode: true
 tasks:
   - name: Conditional debug based on OS
     debug:
       msg: "Running on {{ ansible_facts['os_family'] }} system."
     when: ansible_facts['os_family'] == 'Darwin'

   - name: Debug when in debug mode
     debug:
       msg: "Debug mode is enabled"
     when: debug_mode | bool

   - name: Check environment variable
     debug:
       msg: "ANSIBLE_ENABLE_TASK_DEBUGGER is set to: {{ lookup('env', 'ANSIBLE_ENABLE_TASK_DEBUGGER') }}"

   - name: Use environment variable for debugger
     command: "false"
     register: fail_result
     debugger: "{{ 'on_failed' if lookup('env', 'ANSIBLE_ENABLE_TASK_DEBUGGER') | bool else 'never' }}"
In this playbook, conditional debugging is demonstrated through various when statements, ensuring debug messages are printed only under specific conditions:
- The
"Conditional debug based on OS"task runs only if the system belongs to the Darwin (macOS) family. The example runs on a MacBook, so this debug message appears in the output. - The
"Debug when in debug mode"task prints its message because thedebug_modevariable is explicitly set to true. - The
"Check environment variable"task prints a debug message only if theANSIBLE_ENABLE_TASK_DEBUGGERenvironment variable is set to true. - The
"Use environment variable for debugger"task takes both the environment variable and task success into account. Even ifANSIBLE_ENABLE_TASK_DEBUGGERistrue, the debugger will only activate if the task fails. In this case, the task is set to fail by default, so the debugger terminal opens.
This approach ensures debugging messages and actions are only triggered when needed, keeping playbook output clear and relevant. We will cover interactive debugging in more detail in the next section.
Below is the output produced when executing this playbook:
PLAY [Conditional Debug Examples] *************************************************************************************

TASK [Gathering Facts] ************************************************************************************************
ok: [localhost]

TASK [Conditional debug based on OS] **********************************************************************************
ok: [localhost] => {
    "msg": "Running on Darwin system."
}

TASK [Debug when in debug mode] ***************************************************************************************
ok: [localhost] => {
    "msg": "Debug mode is enabled"
}

TASK [Check environment variable] *************************************************************************************
ok: [localhost] => {
    "msg": "ANSIBLE_ENABLE_TASK_DEBUGGER is set to: true"
}

TASK [Use environment variable for debugger] **************************************************************************
fatal: [localhost]: FAILED! => {"changed": true, "cmd": ["false"], "delta": "0:00:00.004504", "end": "2025-01-05 21:47:29.055200", "msg": "non-zero return code", "rc": 1, "start": "2025-01-05 21:47:29.050696", "stderr": "", "stderr_lines": [], "stdout": "", "stdout_lines": []}
[localhost] TASK: Use environment variable for debugger (debug)>
The when condition helps us limit debugging messages to specific conditions, ensuring that the playbook output remains clean unless there’s an actual need to debug. Environment variables offer a powerful way to control debugging behavior across different systems or environments.
Conditional debugging enhances our ability to handle different scenarios without overwhelming the output. It allows for intelligent logging and debugging based on factors such as system properties or environment settings, making our playbooks both efficient and highly customizable.
Assertion and validation in Ansible
Assertions and validations in Ansible ensure that necessary conditions or variables are met before executing further tasks. The assert module allows you to define checks that verify critical system facts or variable values. If a condition fails, Ansible halts execution and provides a clear error message, preventing misconfigurations causing unintended actions.
This type of validation is essential for maintaining playbook reliability. It ensures that required data is present before proceeding. By proactively catching issues, assertions help avoid failures that could disrupt automation workflows.
In the example below, we use assertions to validate system conditions, ensuring that all necessary information is available before continuing execution.
# Assertion and validation
---
- name: Debug with Assertions
 hosts: localhost
 gather_facts: yes
 tasks:
   - name: Assert system conditions
     assert:
       that:
         - ansible_facts['os_family'] is defined
         - ansible_facts['distribution'] is defined
       fail_msg: "Required system information is missing!"
       success_msg: "System information validated successfully."
The above playbook performs two assertions:
- It checks whether the OS family and distribution are defined in the
ansible_factsobject. - If either is missing, the playbook halts execution and prints a
fail_msgindicating the issue.
However, if the required information is present, a success message is displayed. These system facts are typically available by default, so the playbook runs without issues — even on the localhost where this example is executed. As expected, the output confirms the success message.
PLAY [Debug with Assertions] ******************************************************************************************

TASK [Gathering Facts] ************************************************************************************************
ok: [localhost]

TASK [Assert system conditions] ***************************************************************************************
ok: [localhost] => {
    "changed": false,
    "msg": "System information validated successfully."
}

PLAY RECAP ************************************************************************************************************
localhost                  : ok=2    changed=0    unreachable=0    failed=0    skipped=0    rescued=0    ignored=0
Assertions in Ansible play a crucial role in catching missing or misconfigured facts early in the execution process, preventing subsequent tasks from running with incomplete or incorrect data. Custom failure messages provide clear, actionable feedback, making debugging easier and ensuring that the system meets the required conditions before proceeding.
Validating core system facts — such as OS and distribution — ensures compatibility and reduces the risk of failures during execution when managing complex infrastructure.
This improves playbook reliability and provides early detection of issues, saving time and effort in troubleshooting later in the process.
Interactive troubleshooting in Ansible
Ansible offers interactive debugging tools that allow hands-on troubleshooting during playbook execution. By enabling interactive modes — such as the debug strategy — and using tasks like pause, you can inspect the system state and manually interact with the playbook at specific points.
This is particularly useful when you want to step through tasks, observe system states, or adjust variables on the fly.
The example below demonstrates how to use interactive debugging to pause execution and enable a debugger for specific tasks.
# Interactive debugging
---
- name: Interactive Debugging Examples
 hosts: localhost
 strategy: debug  # Enable debug strategy for all tasks

 tasks:
   - name: Task with always-on debugger
     command: "true"
     debugger: always

   - name: Pause for inspection
     pause:
       prompt: "Press Enter to continue after inspection."
The first task uses the debugger directive, which is set to always. When execution reaches this task, it will always enter in the interactive debugging mode.
In this mode, we can interactively inspect various aspects of the current step by using the commands below:
- p task: Print the task that triggered the debugger
- p task.args: Print the task’s arguments
- p vars: Print available variables
- p host: Print current host information
- p result: Print the task result
- .r: Retry the task
- c: Continue execution
- q: Quit the debugger
The second task uses the pause directive to pause the execution until the investigation at that step is completed and developers are ready to resume it.
The output of executing the Playbook above shows how interactive debugging can help investigate the causes of failure.
PLAY [Interactive Debugging Examples] *********************************************************************************

TASK [Gathering Facts] ************************************************************************************************
ok: [localhost]

TASK [Task with always-on debugger] ***********************************************************************************
changed: [localhost]
[localhost] TASK: Task with always-on debugger (debug)> p task
TASK: Task with always-on debugger
[localhost] TASK: Task with always-on debugger (debug)> p vars
<built-in function vars>
[localhost] TASK: Task with always-on debugger (debug)> p host
localhost
[localhost] TASK: Task with always-on debugger (debug)> p result
<ansible.executor.task_result.TaskResult object at 0x1044cf4f0>
[localhost] TASK: Task with always-on debugger (debug)> r
changed: [localhost]
[localhost] TASK: Task with always-on debugger (debug)> c

TASK [Pause for inspection] *******************************************************************************************
[Pause for inspection]
Press Enter to continue after inspection.:
ok: [localhost]

PLAY RECAP ************************************************************************************************************
localhost                  : ok=3    changed=1    unreachable=0    failed=0    skipped=0    rescued=0    ignored=0
Interactive debugging provides real-time control over playbook execution, letting us inspect and adjust variables, states, and system configurations.
By pausing and inspecting the system, we can gather valuable information before continuing execution, making it easier to troubleshoot issues. It also offers a highly effective method for stepping through and troubleshooting playbooks, particularly in complex automation scenarios.
How to log Ansible debug information
Logging is an essential part of debugging, especially in more complex Ansible playbooks. By logging relevant information to a file, we can review detailed outputs and troubleshoot issues after playbook execution. Ansible allows you to log debug information, which can be invaluable for long-running tasks or when dealing with errors that are difficult to reproduce.
The example below explores how to log information to a file for later review and how to configure logging for better visibility into the execution of our playbooks:
# Advanced debugging techniques
---
- name: Logging
hosts: localhost
gather_facts: yes
vars:
ansible_log_path: "./tmp/ansible_debug.log"
tasks:
- name: Log debug information to file
copy:
content: "{{ ansible_facts | to_nice_json }}"
dest: "{{ ansible_log_path }}"
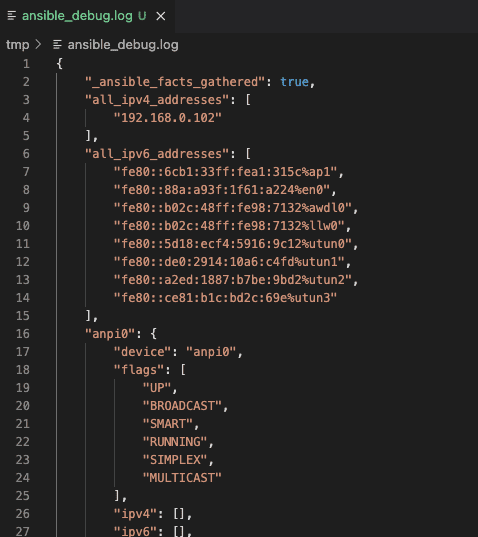
mode: '0644'The single task in the playbook above uses the copy directive to copy the content of an inbuilt variable ansible_facts in a nice JSON format to the log file, the path to which is supplied in the variable.
Optionally, we can also set the ANSIBLE_LOG_PATH environment variable at a global level to log everything at a global level. The output of executing the playbook above is shown below:
PLAY [Logging] ********************************************************************************************************

TASK [Gathering Facts] ************************************************************************************************
ok: [localhost]

TASK [Log debug information to file] **********************************************************************************
changed: [localhost]

PLAY RECAP ************************************************************************************************************
localhost                  : ok=2    changed=1    unreachable=0    failed=0    skipped=0    rescued=0    ignored=0
Below is the screenshot of the contents of the log file generated as a result of the above execution:
Logging debug information to a file ensures that critical data is preserved for later analysis, making it invaluable for troubleshooting intermittent issues or post-execution reviews. Instead of sifting through cluttered terminal output, structured log files provide a clear record of system facts, task outputs, and other essential details.
This method enhances playbook analysis, helping to identify patterns, errors, or inconsistencies that may not be immediately obvious during runtime. It also improves collaboration by providing a reliable reference for debugging across teams.
How Spacelift can help you with Ansible projects
Spacelift’s vibrant ecosystem and excellent GitOps flow can greatly assist you in managing and orchestrating Ansible. By introducing Spacelift on top of Ansible, you can then easily create custom workflows based on pull requests and apply any necessary compliance checks for your organization.
Another great advantage of using Spacelift is that you can manage different infrastructure tools like Ansible, Terraform, Pulumi, AWS CloudFormation, and even Kubernetes from the same place and combine their Stacks with building workflows across tools.
Our latest Ansible enhancements solve three of the biggest challenges engineers face when they are using Ansible:
- Having a centralized place in which you can run your playbooks
- Combining IaC with configuration management to create a single workflow
- Getting insights into what ran and where
Provisioning, configuring, governing, and even orchestrating your containers can be performed with a single workflow, separating the elements into smaller chunks to identify issues more easily.
Would you like to see this in action — or just get a tl;dr? Check out this video showing you Spacelift’s new Ansible functionality:

If you want to learn more about using Spacelift with Ansible, check our documentation, read our Ansible guide, or book a demo with one of our engineers.
Key points
Debugging playbooks is essential for anyone using Ansible, allowing you to pinpoint and fix issues quickly during execution. In this guide, we explored practical debugging techniques, from printing task outputs and inspecting variables to using registered results and adjusting verbosity levels for deeper insights. We also covered advanced strategies like assertions to validate conditions, pausing execution for real-time inspection, and leveraging logging for detailed post-run analysis.
By incorporating interactive debugging, targeted logging, and conditional task execution, you gain finer control over your playbooks, making troubleshooting faster and more effective. Mastering these techniques ensures your automation remains reliable and efficient, even in the most complex environments.
Manage Ansible Better with Spacelift
Managing large-scale playbook execution is hard. Spacelift enables you to automate Ansible playbook execution with visibility and control over resources, and seamlessly link provisioning and configuration workflows.
