
A Terraform configuration with more than a handful of resources gets hard to reason about from the code alone. Which resource depends on which? What does a destroy plan actually touch? The terraform graph command answers those questions by turning your configuration or plan into a dependency graph you can render and inspect.
In this article, you’ll learn what Terraform graphs are, how to use the command with examples, techniques for handling larger graphs, and the visualization tools worth knowing about.
We will cover:
What are Terraform graphs?
The Terraform graph command generates a visual representation of the dependency relationships between resources in your Terraform configuration or execution plan, helping you to understand the structure and dependencies within your infrastructure.
These graphs can also be useful for identifying potential issues, planning changes, and debugging. Each resource is represented as a node, and the arrows between nodes represent the dependencies between resources.
Graphs are generated in the DOT output format, a text-based graph description language, which can be processed by GraphViz software to create visual diagrams (e.g., PNG, SVG).
The graph command does not create or apply any infrastructure changes; it’s purely for visualization. For large or complex graphs, breaking them down into smaller sections or using interactive visualizations (see later section on other available tools) can improve readability.
How to use the Terraform graph command?
To generate a Terraform graph type:
terraform graph [options]By default, terraform graph (with no options) produces a simplified graph showing only the dependency ordering of resource and data blocks in your configuration.
-type=...— Selects a specific operation type instead of the default resources-only graph. Accepted values:plan— graph for the plan operationplan-refresh-only— graph for a refresh-only planplan-destroy— graph for a destroy planapply— graph for the apply operation
-draw-cycles— Highlights cycles in the graph with colored edges, useful for diagnosing cycle errors. Only supported when-type=...is also set.-plan=tfplan— Renders the graph for a previously saved plan file. Implies-type=apply.
Terraform graph examples
My Terraform configuration file main.tf contains the following to create an nginx Docker image:
terraform {
  required_providers {
    docker = {
      source  = "kreuzwerker/docker"
      version = "~> 4.2"
    }
  }
}

provider "docker" {}

# Pull the ubuntu image
resource "docker_image" "ubuntu" {
  name = "ubuntu:latest"
}

# Run a container from the ubuntu image
resource "docker_container" "webserver" {
  image             = docker_image.ubuntu.image_id
  name              = "terraform-docker-test"
  must_run          = true
  publish_all_ports = true
  command = [
    "tail",
    "-f",
    "/dev/null",
  ]
}

resource "docker_image" "nginx" {
  name         = "nginx:latest"
  keep_locally = false
}

resource "docker_container" "nginx" {
  image = docker_image.nginx.image_id
  name  = "nginx-test"
  ports {
    internal = 80
    external = 8000
  }
}

resource "docker_network" "private_network" {
  name = "my_network"
}

resource "docker_volume" "shared_volume" {
  name = "shared_volume"
}
To visualize the dependencies, I simply run:
terraform graphThis provides me with the code in DOT output format:
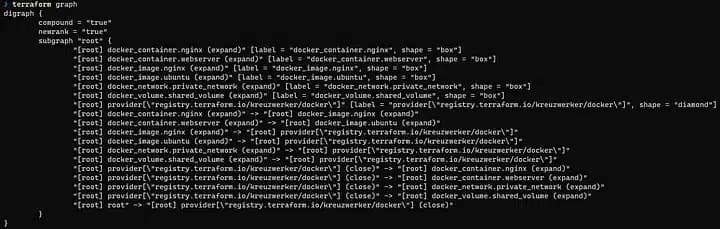
I paste this code into the online graph viewer Webgraphviz, which generates my visual representation!
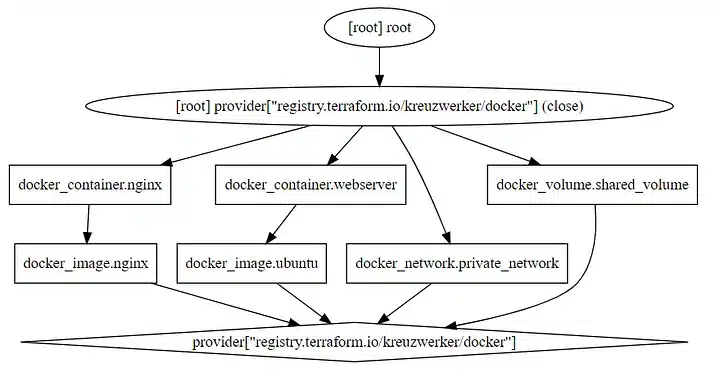
If you have installed Graphviz, you can also generate the dot output file directly on the command line and then use the dot command to generate the PNG file:
terraform graph > graph.dot
dot -Tpng graph.dot -o graph.png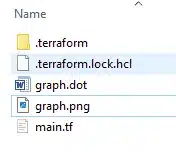
Working with large or complex graphs
As your configuration grows, terraform graph output can become dense and hard to read. A few techniques help keep it useful:
- Render to SVG instead of PNG. SVG scales without losing quality, so you can zoom into any part of the diagram in a browser:
terraform graph | dot -Tsvg > graph.svg- Stick to the default graph type. Running
terraform graphwith no-typeflag gives you a simplified resource-only view, which is usually cleaner than-type=planor-type=applyfor getting a high-level picture. Reach for the detailed types only when debugging a specific phase. - Filter the DOT output. DOT is plain text, so you can narrow the scope with
grepbefore rendering, for example to isolate a single module:
terraform graph | grep "module.networking" > networking.dot
dot -Tsvg networking.dot -o networking.svg- Switch to an interactive tool. Beyond a few dozen resources, a static image is the wrong format. The tools covered in the next section let you pan, zoom, and click through dependencies without manually carving up the output.
Other Terraform visualization tools
Visualizing complex graphs can be challenging. For more interactive or alternative visualizations, you can consider tools like Blast Radius, Inframap, Rover, or Terraform Visual. These tools offer different features.
1. Terraform Visual
Terraform Visual is a free and open-source tool specifically designed to visualize your Terraform plan interactively. To try it out, simply generate your plan file using the commands below and upload it here.
$ terraform plan -out=plan.out$ terraform show -json plan.out > plan.json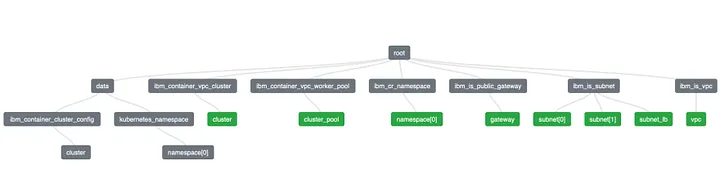
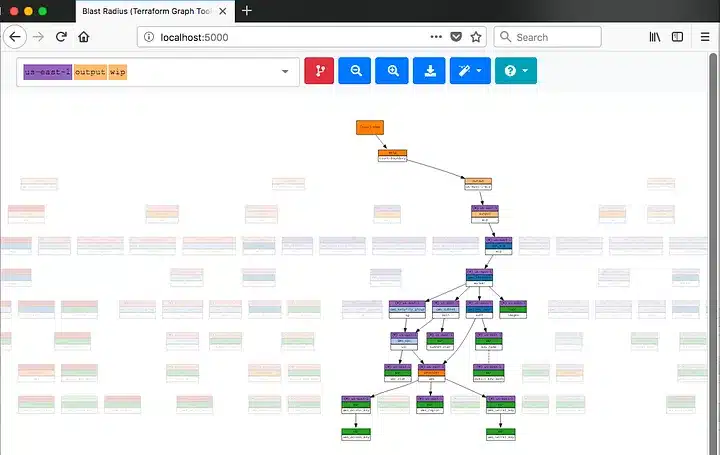
2. Blast radius
Blast Radius generates interactive dependency visualizations using d3.js.
Note that the original project has not been actively maintained since 2020 and may have compatibility issues with Terraform 1.x and later. An actively maintained community fork is available at Ianyliu/blast-radius-fork if you want to keep using it on modern Terraform versions.
3. Inframap
Inframap reads your tfstate or HCL to generate a graph specific for each provider, showing only the resources that are most important/relevant.

4. Rover
Rover is an actively maintained interactive Terraform visualizer that explores both configuration and state. It runs a local web server with a browsable view of your resources, modules, and dependencies, and can export the visualization as an SVG.
The fastest way to try it is via Docker, run from inside a Terraform working directory:
docker run --rm -it -p 9000:9000 -v $(pwd):/src im2nguyen/roverThen open http://localhost:9000 in your browser.
5. WebGraphviz and GraphvizOnline
Lastly, if you cannot make changes to your local system, online services like WebGraphviz and GraphvizOnline can render DOT files without installing software.
Since AI-driven commercial property risk platform Archipelago started working with Spacelift, they have eliminated manual processes around direct Terraform applications and streamlined change coordination among their engineers.
Key points
The terraform graph command in Terraform is used to generate a visual representation of the dependency graph of your infrastructure. There are many useful alternatives, so have fun experimenting with these and finding the right option for you.
Terraform is really powerful, but managing imports, state, and configuration at scale requires more than the CLI alone. Spacelift takes Terraform management to the next level by giving you access to a powerful CI/CD workflow and features such as:
- Policy as code (based on Open Policy Agent) to enforce guardrails on every plan and apply
- Drift detection to catch resources that have changed outside of Terraform
- Multi-IaC workflows across Terraform, OpenTofu, CloudFormation, Pulumi, and Kubernetes
- Self-service infrastructure through Blueprints and Templates
- Full audit trails so you always know what changed, when, and who approved it
If you want to learn more about Spacelift, create a free account today or book a demo with one of our engineers.
Note: New versions of Terraform are placed under the BUSL license, but everything created before version 1.5.x stays open-source. OpenTofu is an open-source version of Terraform that expands on Terraform’s existing concepts and offerings. It is a viable alternative to HashiCorp’s Terraform, being forked from Terraform version 1.5.6.
Manage Terraform better and faster
If you are struggling with Terraform automation and management, check out Spacelift. It helps you manage Terraform state, build more complex workflows, and adds several must-have capabilities for end-to-end infrastructure management.
Frequently asked questions
How do I visualize Terraform dependencies?
Run terraform graph from your initialized configuration directory to output a DOT-format dependency graph, then pipe it into Graphviz (for example, terraform graph | dot -Tsvg > graph.svg) to render it as an image. Tools like Rover, Inframap, or Terraform Visual offer richer, more interactive alternatives.
What are the -type options for terraform graph?
The -type flag accepts plan, plan-refresh-only, plan-destroy, and apply, each producing a more detailed graph for that specific operation instead of the default simplified resource view. Omitting -type returns the default configuration-level dependency graph.
How to convert terraform graph to PNG / SVG?
Pipe the DOT output through Graphviz’s dot command with the desired format flag: terraform graph | dot -Tpng > graph.png for PNG, or terraform graph | dot -Tsvg > graph.svg for SVG. Install Graphviz first if it isn’t already on your system.
HashiCorp Developer | Terraform Docs. terraform graph command reference. Accessed: 13 May 2026
Graphviz Documentation. About Graph Visualization. Accessed: 13 May 2026
