
Observability tools provide deep, real-time insight into how your systems behave, enabling you to detect issues early, troubleshoot more efficiently, and deliver a more reliable digital experience.
Instead of guessing what’s happening inside complex, distributed environments, these platforms collect and correlate data from metrics, logs, and traces to show a complete picture of application and infrastructure health.
Modern observability solutions are especially important for cloud-native architectures, microservices, and containerized workloads, where traditional monitoring alone is no longer enough. By centralizing telemetry data, they help teams quickly pinpoint performance bottlenecks, uncover hidden errors, and understand the impact of code changes in production.
In this guide, we’ll walk through what observability tools are, the features that matter most, and how different types of platforms approach the problem.
What are observability tools?
Observability tools are the systems you use to understand what your software is doing in production and why it is behaving that way. They collect and analyze telemetry data so you can see how services behave over time, catch problems early, and debug incidents without guessing.
Instead of just telling you “something is broken,” observability tools help you answer “where, how, and what changed.”
In practice, these tools work with three main types of data:
- Metrics for numeric time-series data, like latency, error rates, CPU, or queue depth
- Logs for detailed, event-level records from applications and infrastructure
- Traces for following a single request as it hops through microservices
Modern observability platforms pull all of this into one place, then add dashboards, alerts, search, correlation, SLOs, and analytics. For a DevOps or SRE team, this means you can monitor high-level health, drill into a single request, pivot into related logs, and confirm the impact on users, all within one workflow.
Features to look for in observability tools
Here are the core features worth paying attention to when you evaluate observability tools, especially for modern, distributed systems.
- Unified view of metrics, logs, and traces – This is the backbone. If you cannot jump from a failing metric, to the related trace, to the exact log lines in a few clicks, you are not doing real observability, you are just collecting data.
- Powerful query and search – You need to be able to ask messy, real-world questions and get answers quickly. Filtering by service, endpoint, tenant, version, or region should feel natural, not like wrestling a database course project.
- Smart alerting and noise reduction – Reliable alerts that avoid spam are what protect on-call sanity. Look for multi-condition rules, dynamic thresholds, and alert grouping so incidents become clear, actionable problems, not a wall of red.
- Strong correlation and context – The tool should help you answer “what changed” and “who is impacted” without guesswork. Things like deployment markers, service maps, and automatic linking across signals save hours during real incidents.
- Scalability and efficient storage – Telemetry data always grows faster than you expect. You want a system that can scale with your traffic, keep queries responsive, and give you knobs for retention, downsampling, and cost control without losing the big picture.
How we review software at Spacelift
We aim to make our recommendations practical and vendor-neutral. For each tool we include, we evaluate category fit, core capabilities, integrations, documentation quality, security/governance features (when relevant), and pricing transparency. We also reference public review signals to validate common strengths and limitations.
Top observability tools
Before selecting a specific product, it is helpful to understand that no single tool covers every use case equally well. Some platforms excel at full-stack visibility across metrics, logs, and traces, while others go deep on a single layer, such as metrics, logging, or distributed tracing.
The right mix for your team depends on your stack, scale, and budget, as well as how much control you want over data storage and operations.
The most popular observability tools include:
1. Prometheus
Prometheus is an open-source systems monitoring and alerting toolkit that focuses on metrics and time series data. It was originally built at SoundCloud and is now a graduated CNCF (Cloud Native Computing Foundation) project, which has helped it become a de facto standard for monitoring Kubernetes and cloud-native infrastructure.
Prometheus is often used as the metrics engine at the core of an observability stack, especially when teams want strong control over how data is collected, stored, and queried.
At its core, Prometheus collects metrics from targets using an HTTP pull model, stores them in a purpose-built time-series database, and lets you explore that data using PromQL, a flexible query language designed for multi-dimensional metrics.
A large ecosystem of exporters, client libraries, and integrations makes it straightforward to instrument applications, scrape infrastructure, and send alerts through Alertmanager or external tools.
For long-term storage and richer dashboards, Prometheus is frequently paired with remote storage backends and visualization tools such as Grafana.
Key features of Prometheus
- Metrics focused, pull based model: Prometheus scrapes metrics over HTTP from configured targets, which simplifies deployment and gives operators precise control over what is collected and when.
- Multi dimensional data model: Metrics are stored as time series with labels, which lets you slice and filter by service, instance, region, HTTP status, and many other dimensions without changing the schema.
- Powerful query language (PromQL): PromQL enables ad hoc analysis, dashboard queries, and alert rules using functions for aggregation, rate calculation, and temporal logic on live time series.
License/Pricing: Apache License 2.0 (open-source)
Prometheus ratings and reviews:
- G2: 4.5/5 (61 reviews)
Website: https://prometheus.io
Official documentation: https://prometheus.io/docs/introduction/overview/
Read more: Configuring Prometheus with Helm Chart on Kubernetes
2. Grafana
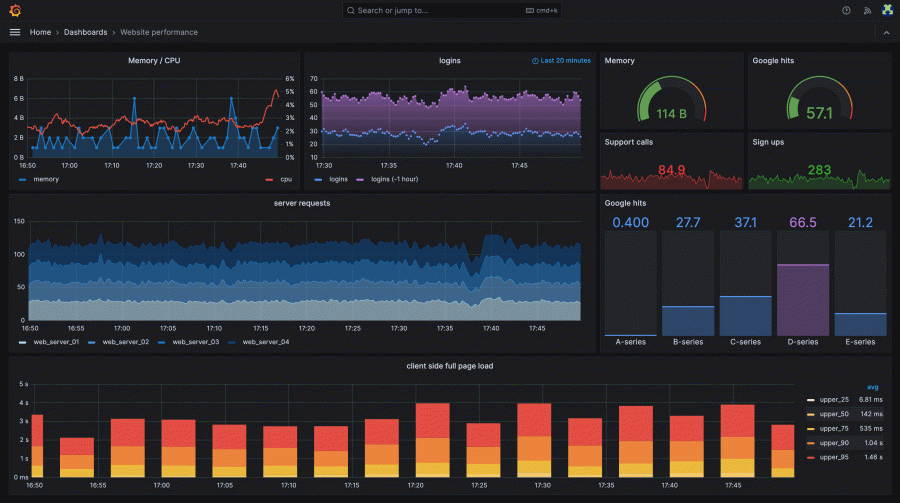
Grafana is a multi-platform, open-source analytics and visualization application that teams use to build dashboards and explore observability data across metrics, logs, and traces. It sits on top of existing data sources such as Prometheus, Loki, InfluxDB, Elasticsearch, PostgreSQL, and many others, which makes it a common choice as the shared front end for heterogeneous monitoring stacks.
Grafana often appears as the visualization layer that helps engineers correlate signals from infrastructure, applications, and services in a single, consistent interface.
The core product focuses on interactive dashboards, alerting, and exploratory analysis, while the broader Grafana offering includes hosted Grafana Cloud and Grafana Enterprise editions that add managed infrastructure, enterprise plugins, and advanced collaboration features.
Teams can deploy Grafana OSS on their own infrastructure or consume it as a fully managed cloud service, which makes it suitable both for smaller setups and large scale environments with many teams and datasets.
Key features of Grafana
- Unified dashboards across many data sources: Connects to a wide range of backends such as Prometheus, Loki, Graphite, InfluxDB, Elasticsearch, SQL databases, and commercial observability platforms, letting you visualize and correlate data without moving it.
- Rich visualization and alerting tools: Provides flexible panels for charts, graphs, and other visualizations, along with configurable alerting that can route notifications to systems like PagerDuty, Slack, email, and other channels.
- Plugin and extension ecosystem: Supports a mature plugin framework for data sources, panels, and apps, which allows organizations to integrate ticketing tools, CI/CD platforms, and additional databases into the same observability view.
License/Pricing: GNU Affero General Public License v3.0 (AGPL-3.0-only), free and open source, with commercial Grafana Enterprise and Grafana Cloud offerings available on a subscription basis
Grafana ratings and reviews:
- G2: 4.5/5 (153 reviews)
Website: https://grafana.com
Official documentation: https://grafana.com/docs/grafana/latest/
3. OpenTelemetry
OpenTelemetry provides a vendor-neutral framework for generating, collecting, and exporting telemetry data from modern distributed systems. It focuses on three primary signals, which are traces, metrics, and logs, and gives teams a consistent way to instrument applications, services, and infrastructure without locking into a single observability vendor.
The project is part of the CNCF and grew out of a merger between OpenTracing and OpenCensus, which helped it quickly become a common standard for instrumentation across the cloud native ecosystem.
Instead of storing or visualizing data itself, OpenTelemetry acts as the collection layer in an observability stack. SDKs and auto-instrumentation agents capture telemetry in various languages. The OpenTelemetry Collector receives and processes this data, then exports it to a wide range of backends, including Prometheus, Jaeger, Tempo, or commercial observability platforms, using the OpenTelemetry Protocol, also known as OTLP.
This design allows engineering teams to standardize how they instrument code and infrastructure while keeping the choice of backend open, which is useful when tools change over time or different teams prefer different vendors.
Key features of OpenTelemetry
- Vendor-neutral standard for telemetry: Defines common specifications, APIs, and data formats so that traces, metrics, and logs can be produced in a consistent way and sent to many different observability backends.
- Language SDKs and auto instrumentation: Offers officially supported SDKs and zero code or low code instrumentation options for popular languages such as Java, Python, .NET, JavaScript, and more, which reduces the effort required to roll out telemetry at scale.
- Collector and OTLP for flexible pipelines: Provides the OpenTelemetry Collector and the OTLP protocol so teams can receive, process, transform, and route telemetry from many sources to one or more destinations in a centralized, configurable pipeline.
License/Pricing: Apache License 2.0 (open source)
Website: https://opentelemetry.io
Official documentation: https://opentelemetry.io/docs/
4. Jaeger
Jaeger is an open-source distributed tracing platform used to monitor and debug microservices-based architectures.
Originally created at Uber and now a graduated CNCF project, Jaeger helps teams understand how individual requests flow through many services and where latency or errors are introduced. It is commonly adopted as the tracing layer in cloud native observability stacks alongside tools like Prometheus, Grafana, and OpenTelemetry.
By collecting and visualizing traces, Jaeger allows engineers to follow transactions across services, analyze service dependencies, and perform root cause analysis when performance or reliability issues appear.
Features such as adaptive sampling, multiple storage backends, topology graphs, and OpenTelemetry compatibility make it suitable for both new deployments and environments that are standardizing on OpenTelemetry for instrumentation.
Key features of Jaeger
- Distributed tracing for microservices: Captures and visualizes end-to-end traces across services so teams can see how requests propagate, where time is spent, and which components are contributing to latency or errors.
- Service dependency and topology analysis: Builds graphs of how services interact, which helps with understanding architecture, identifying critical paths, and spotting unintended dependencies.
- Tight integration with OpenTelemetry: Works with OpenTelemetry SDKs and the OpenTelemetry Collector, which lets teams standardize instrumentation while using Jaeger as one of the primary tracing backends.
License/Pricing: Apache License 2.0 (open source)
Jaeger ratings and reviews:
- G2: 4.4/5 (15 reviews)
Website: https://www.jaegertracing.io
Official documentation: https://www.jaegertracing.io/docs/latest/
5. ELK Stack or OpenSearch
ELK Stack and OpenSearch both sit in the log analytics and search layer of an observability stack. ELK refers to Elasticsearch, Logstash, and Kibana, which together are widely used to ingest, index, and visualize large volumes of machine-generated data such as application logs and infrastructure events.
Elastic now tends to use the term Elastic Stack, but the core idea remains a scalable search engine at the center, plus ingest and dashboarding components that support real-time operations and troubleshooting.
OpenSearch is a community-driven fork of open source Elasticsearch 7.10 that adds its own visualization layer, OpenSearch Dashboards, and keeps the stack under the Apache 2.0 license. It is designed for similar use cases such as log analytics, application and website search, and observability scenarios that need fast, distributed search and analytics at scale without vendor lock-in.
Key features
- Centralized log and event analytics: Collects logs and other machine data, indexes them in a distributed engine, and lets teams run free text search, filtering, and aggregations to investigate issues and spot patterns.
- Flexible ingest and pipeline options: Uses components such as Logstash, Beats, or OpenSearch ingest pipelines to parse, enrich, and route data from many sources including containers, Kubernetes, and traditional servers.
- Scalable, distributed architecture: Relies on sharding and replication across nodes so that clusters can handle high event volumes and large historical retention while maintaining fast query response times.
License/Pricing: OpenSearch is Apache License 2.0, free and open source. The Elastic Stack components that underpin the classic ELK Stack are source available under Elastic License 2.0 and Server Side Public License, with paid Elastic subscriptions for commercial features and support
Website: https://opensearch.org / https://www.elastic.co/elastic-stack
Official documentation: https://docs.opensearch.org/latest/ / https://www.elastic.co/guide/index.html
6. Graylog
Graylog is a source available SIEM and log analytics platform that centralizes machine generated data from infrastructure, applications, and security tools. It is often chosen as the log and security analysis layer in observability stacks where teams want fast search, correlation, and alerting on top of large log volumes.
The platform collects, parses, indexes, and analyzes logs in near real time, with features for dashboards, alerting, investigations, and long-term retention.
Its architecture combines Graylog server components with Data Node (which manages OpenSearch as the search backend) for storage and MongoDB for configuration, and it can be deployed on premises, in the cloud, or consumed as a managed offering.
Key features of Graylog
- Centralized log and security analytics: Aggregates logs from many sources into a single platform for operational troubleshooting, security monitoring, and compliance reporting.
- Fast search and filtering: Provides powerful search across indexed log data so engineers and analysts can quickly pivot on fields, time ranges, and contexts during incidents.
- Dashboards, alerts, and investigations: Offers customizable dashboards, alert rules, correlation features, and investigation workflows that help teams move from detection to root cause analysis.
License/Pricing: Graylog Open is licensed under the Server Side Public License (SSPL), source available, with commercial Graylog Operations and Graylog Security editions offered on a subscription basis
Graylog ratings and reviews:
- G2: 4.4/5 (117 reviews)
Website: https://graylog.org
Official documentation: https://go2docs.graylog.org/current/home.htm
7. Loki
Loki is a log aggregation system from Grafana Labs that focuses on storing and querying logs from applications and infrastructure in a cost efficient way. Instead of indexing the full log body, Loki indexes only labels that describe each log stream, which keeps the index small and aligns closely with the Prometheus style of metrics labeling.
It is used as the logging backend in many cloud native observability stacks and is often paired with Grafana for visualization.
Logs are typically shipped to Loki through Grafana Alloy, the recommended collector that replaces Grafana Agent and Promtail, using a push model. Loki stores data in compressed chunks and exposes a query language called LogQL that lets engineers filter, aggregate, and correlate logs over time.
The project is built as a distributed set of services that can run in different deployment modes and it is available both as open source software and as a managed service through Grafana Cloud.
Key features of Loki
- Label based indexing for logs: Uses labels as the primary index, similar to Prometheus, which reduces index size and helps correlate metrics and logs using the same label model.
- Cost efficient, scalable architecture: Designed as a horizontally scalable, multi-tenant system with small indexes and compressed chunks so it can handle large log volumes while controlling storage and compute costs.
- Tight integration with Grafana: Acts as a first class data source for Grafana, so teams can build dashboards and views that combine Loki logs with metrics and traces from other tools.
License/Pricing: GNU Affero General Public License v3.0 (AGPL-3.0-only) as the default license, free and open source, with some components under Apache 2.0 and commercial offerings available through Grafana Cloud and related services Grafana
Website: https://grafana.com/oss/loki/
Official documentation: https://grafana.com/docs/loki/latest/
8. Tempo
Grafana Tempo is a high-scale distributed tracing backend that focuses on cost-efficient storage and simple operations.
Instead of relying on heavy index structures, Tempo keeps trace data in object storage and uses other signals, such as logs and metrics, to help locate relevant traces, which makes it attractive for large Kubernetes and microservices environments. It integrates naturally with the broader Grafana ecosystem and can ingest common tracing formats from OpenTelemetry, Jaeger, and Zipkin.
In an observability stack, Tempo typically acts as the trace storage and query engine that sits alongside Prometheus for metrics and Loki or another system for logs. Engineers use Grafana to discover traces, link them to related logs and metrics, and generate metrics from spans for ongoing monitoring.
The design is meant to give teams distributed tracing at scale while keeping infrastructure requirements focused on object storage and a set of stateless services.
Key features of Tempo
- High scale, minimal dependency tracing backend: Stores large volumes of trace data in object storage so clusters can grow without bringing in additional databases such as Elasticsearch or Cassandra.
- Index free, cost efficient approach: Avoids full indexing of spans and instead relies on time based storage and integration with logs and metrics, which reduces infrastructure overhead for long term trace retention.
- Deep integration with Grafana: Works as a native data source in Grafana so users can navigate from metrics and logs to related traces and build cross signal dashboards.
License/Pricing: GNU Affero General Public License v3.0 (AGPL-3.0-only) as the default license, free and open source, with certain components and tooling under Apache License 2.0
Website: https://grafana.com/oss/tempo/
Official documentation: https://grafana.com/docs/tempo/latest/
9. Fluent Bit / Fluentd
Fluent Bit and Fluentd form a pair of open source data collectors that sit in the log and telemetry pipeline of many observability stacks.
Fluent Bit is a fast, lightweight telemetry agent that runs close to the source and collects logs, metrics, and traces with a small resource footprint. Fluentd is a more feature rich data collector that focuses on building a unified logging layer and routing events from many inputs to many backends.
Together, they give teams fine-grained control over how data is collected at the edge and processed centrally.
In typical deployments, Fluent Bit runs on hosts, containers, or Kubernetes nodes, where it gathers telemetry and forwards it to Fluentd or directly to systems such as Elasticsearch, OpenSearch, Kafka, cloud logging services, or observability backends. Fluentd then applies richer buffering, filtering, transformation, and fan out to multiple destinations through its large plugin ecosystem.
Both projects are graduated in the CNCF family, which means they are widely used in production and maintained by an active community.
Do you want a lightweight agent on every node and a central router you can tune in detail? That is the common pattern where Fluent Bit and Fluentd are adopted together.
Key features
- Lightweight telemetry collection with Fluent Bit: Acts as a small footprint agent that can collect, process, and forward logs, metrics, and traces from many platforms, which fits well in containerized and resource constrained environments.
- Unified logging layer with Fluentd: Provides a central data collector that can ingest, parse, transform, and route events from many sources to multiple backends, giving teams a single place to shape their logging strategy.
- Rich plugin ecosystems: Offers hundreds of plugins for inputs, filters, and outputs, which makes it possible to connect to databases, message queues, cloud services, observability platforms, and custom systems without custom code.
License/Pricing: Fluent Bit and Fluentd are licensed under Apache License 2.0, free and open source
Fluentd ratings and reviews:
- G2: 4.4/5 (15 reviews)
Website: https://fluentbit.io / https://www.fluentd.org
Official documentation: https://docs.fluentbit.io/ / https://docs.fluentd.org/
10. Thanos
Thanos is an open source project that augments Prometheus with high availability, long term storage and a global view of metrics across clusters. It builds on the Prometheus 2.0 storage format and uses object storage such as S3, GCS or Azure Blob to keep historical data while still supporting efficient queries.
Thanos is an incubating CNCF project and is commonly evaluated as the long-term metrics layer in cloud native observability stacks.
In practice, Thanos is deployed as a collection of services that sit beside existing Prometheus servers. A sidecar uploads blocks to object storage, store gateways and receivers expose that data, the querier provides a unified Prometheus compatible API, and components like the compactor handle downsampling and retention.
This model lets teams scale Prometheus across regions and clusters, keep metrics for years, and deduplicate data from highly available Prometheus pairs without changing how engineers write queries.
Key features of Thanos
- Global query view across Prometheus: Exposes a single query endpoint that aggregates metrics from multiple Prometheus servers and clusters, including support for deduplicating data from HA pairs.
- Long term, object storage backed metrics: Uploads Prometheus blocks to object storage providers and queries them through store gateways so organizations can retain metrics for long periods in a cost-efficient way.
- High availability for metrics: Extends Prometheus with replication and failover patterns that keep queries available even when individual Prometheus instances or components are down.
License/Pricing: Apache License 2.0 (open source)
Website: https://thanos.io
Official documentation: https://thanos.io/tip/thanos/getting-started.md
11. VictoriaMetrics
VictoriaMetrics is a fast, cost efficient and highly scalable open source time series database and monitoring solution built for metrics heavy workloads. It is often used as long term storage for Prometheus or as a drop in replacement for Prometheus and Graphite in Grafana, which makes it a common choice when teams outgrow a single Prometheus server but want to keep existing dashboards and workflows.
The project focuses on high ingestion rates, strong compression and simple operations, with both single node and clustered configurations available along with a managed VictoriaMetrics Cloud service and an enterprise edition.
Components such as vmagent, vmalert and a Kubernetes operator help integrate VictoriaMetrics into larger observability setups, while support for PromQL and MetricsQL gives engineers flexible ways to query and analyze metrics at scale.
Key features of VictoriaMetrics
- High-performance, compressed time series storage: Optimized for very high write throughput and efficient disk usage, so it can handle millions of samples per second and long retention with relatively modest hardware.
- Prometheus and Graphite compatibility: Works as long-term remote storage for Prometheus and can act as a drop-in replacement for Prometheus and Graphite in Grafana, thanks to compatible ingestion and query APIs.
- Flexible deployment models: Supports single binary setups, horizontally scalable clusters, and Kubernetes operator-based deployments, as well as a fully managed cloud offering and enterprise builds with additional features.
License/Pricing: Apache License 2.0, free and open source, with paid VictoriaMetrics Enterprise and VictoriaMetrics Cloud offerings available for additional capabilities and support
VictoriaMetrics ratings and reviews:
- G2: 5/5 (3 reviews)
Website: https://victoriametrics.com
Official documentation: https://docs.victoriametrics.com/
12. SigNoz
SigNoz is an open-source, OpenTelemetry-native observability platform that brings together application performance monitoring, logs, metrics, traces, exceptions, and alerts in one place. It is often positioned as a full-stack alternative to tools like Datadog or New Relic, particularly for teams seeking vendor-neutral instrumentation and greater control over costs.
SigNoz focuses on providing engineers with a single interface to investigate performance issues, follow traces, explore logs, and monitor key metrics without juggling multiple products.
The platform can be deployed as a self-hosted, open-source stack or consumed as SigNoz Cloud, with both options built around OpenTelemetry-based ingestion for common languages and frameworks. Features such as dashboards, query builder, alerting, exceptions tracking, and deep filtering across traces and logs are designed to support day-to-day troubleshooting and ongoing SLO-style monitoring.
Key features of SigNoz
- Unified view of logs, metrics, and traces: Combines multiple signals, including exceptions and alerts, in a single application so teams can pivot between traces, related logs, and time series metrics during investigations.
- OpenTelemetry native ingestion: Built around OpenTelemetry for instrumentation and data collection, which reduces vendor lock-in and simplifies sending telemetry from many languages and services.
- APM and application troubleshooting: Provides application performance monitoring views, trace explorer, log explorer, and exception tracking that help engineers understand latency, errors, and service dependencies.
License/Pricing: Open source core under Apache License 2.0, free to self-host, with paid SigNoz Cloud and SigNoz Enterprise offerings that use usage-based pricing for telemetry and additional enterprise features and support
Website: https://signoz.io
Official documentation: https://signoz.io/docs/
13. Datadog
Datadog is a cloud-based observability and security platform that brings infrastructure monitoring, log management, application performance monitoring, and more into one SaaS product. It is designed for teams running complex cloud or hybrid environments who need to see metrics, logs, traces, real user data, and security signals in a single place to understand system health and user experience.
Datadog is widely used across SaaS, enterprise, and digital native companies as a central hub for operations, SRE, and security teams.
The platform offers a large catalog of integrations, agents, and SDKs to ingest telemetry from cloud providers, containers, hosts, applications, databases, and network devices. Features such as dashboards, correlation between traces and logs, real-user and synthetic monitoring, and security detection workflows are designed to help teams transition from detection to root cause analysis and response within a single interface.
Datadog is delivered as a multi-tenant SaaS service with regional sites and a usage-based pricing model that varies by product area, such as infrastructure, logs, APM, or security.
Key features of Datadog
- Unified observability across metrics, logs, and traces: Combines infrastructure monitoring, log management, APM, real user monitoring, synthetics, and more so teams can correlate signals and investigate incidents from one place.
- Extensive integrations and data collection: Provides agents, SDKs, and more than a thousand integrations to collect telemetry from major cloud platforms, containers, databases, messaging systems, and third-party services.
- Dashboards, analytics, and alerting: Offers configurable dashboards, analytics views, and alerting that let engineers and SREs visualize trends, define SLO like monitors, and receive notifications when conditions are breached.
License/Pricing: Commercial SaaS platform with a tiered, usage-based pricing model that charges by hosts, containers, custom metrics, ingested logs, traces, and enabled features such as APM or security products
Datadog ratings and reviews:
- G2: 4.4/5 (690 reviews)
Website: https://www.datadoghq.com
Official documentation: https://docs.datadoghq.com/
Read more: Terraform Datadog Provider – How to Manage & Examples
14. New Relic
New Relic is an observability platform that provides application performance monitoring, infrastructure monitoring, log management, and related capabilities through a unified SaaS offering. It is built around the idea of a single telemetry platform where metrics, events, logs, and traces are stored in one database and explored through a common interface.
Engineering and SRE teams use New Relic to track service performance, understand dependencies, and monitor user experience across cloud and hybrid environments.
The platform centers on the New Relic agent and OpenTelemetry-compatible ingestion, which collect telemetry from applications, hosts, containers, and cloud services. Data is queried using NRQL, New Relic’s query language, and visualized through dashboards, service maps, distributed tracing views, and alert conditions.
New Relic is delivered as a managed SaaS product with a consumption-based pricing model that typically combines user seats with usage-based telemetry charges.
Key features of New Relic
- Full-stack observability across apps and infrastructure: Brings APM, infrastructure monitoring, browser and mobile monitoring, synthetics, and logs together so teams can investigate issues from backend to frontend.
- Unified telemetry platform with NRDB and NRQL: Stores metrics, events, logs, and traces in one database, queried via NRQL for dashboards, alerts, and analytics on top of the same data.
- OpenTelemetry and ecosystem integrations: Offers native OpenTelemetry support and many integrations with cloud providers, databases, and messaging systems to simplify data ingestion.
License/Pricing: Commercial SaaS platform with a usage-based pricing model that combines per-user access with charges based on ingested telemetry data
New Relic ratings and reviews:
- G2: 4.4/5 (584 reviews)
Website: https://newrelic.com
Official documentation: https://docs.newrelic.com/
15. Dynatrace
Dynatrace is an observability and application performance platform that combines telemetry collection with AI-assisted analysis in a single SaaS offering. It is used to monitor applications, infrastructure, user experience, and security across cloud native, hybrid, and traditional environments.
Dynatrace centers on its OneAgent technology and the Dynatrace platform, which automatically discovers services, maps dependencies, and surfaces issues with contextual detail rather than raw signals alone.
The platform stores telemetry in its Grail data lakehouse, correlates signals using the Davis AI engine, and exposes insights through dashboards, topology maps, code-level traces, and problem views.
Teams typically adopt Dynatrace when they want a tightly integrated stack that covers APM, infrastructure, logs, real user monitoring, and application security with a strong focus on automation and root cause analysis.
Key features of Dynatrace
- All in one observability and security platform: Covers application performance, infrastructure, logs, real user monitoring, synthetics, and application security in a single product so teams can work from one shared view.
- Automatic discovery and topology mapping: Uses OneAgent to auto-detect services, processes, hosts, containers, and dependencies, building a live topology that underpins analysis and troubleshooting.
- Davis AI for root cause and analytics: Applies AI-based correlation and causal analysis to telemetry so alerts are grouped into problems with likely root causes, instead of isolated metric or log alerts.
License/Pricing: Commercial platform with a subscription and consumption based pricing model that varies by monitored hosts, cloud workloads, and enabled capabilities such as APM, logs, and security
Dynatrace ratings and reviews:
- G2: 4.5/5 (1359 reviews)
Website: https://www.dynatrace.com
Official documentation: https://docs.dynatrace.com/
How to improve your workflows with Spacelift
Spacelift allows you to connect to and orchestrate all of your infrastructure tooling, including infrastructure as code, version control systems, observability tools, governance solutions, and cloud providers.
Spacelift enables powerful CI/CD workflows for OpenTofu, Terraform, Pulumi, Kubernetes, and more. It also supports observability integrations with Prometheus and Datadog, letting you monitor the activity in your Spacelift stacks precisely.
Spacelift also offers a two-path deployment model: rigorous IaC and GitOps for production workloads, and Intent for fast, non-critical provisioning using natural language, with the same policies, visibility, and audit trails across both paths.

With Spacelift, you get:
- Multi-IaC workflows
- Stack dependencies: You can create dependencies between stacks and pass outputs from one to another to build an environment promotion pipeline more easily.
- Policies and integrations: Spacelift allows you to implement any type of guardrails and integrate with any tool you want. You can control how many approvals you need for a run, which resources can be created, which parameters those resources can have, what happens when a pull request is open, and where to send your notifications data.
- High flexibility: You can customize what happens before and after runner phases, bring your own image, and even modify the default workflow commands.
- Self-service infrastructure via Blueprints: You can define infrastructure templates that are easily deployed. These templates can have policies/integrations/contexts/drift detection embedded inside them for reliable deployment.
- Drift detection & remediation: Ensure the reliability of your infrastructure by detecting and remediating drift.
- Resource visibility: See every managed resource, its state, and its drift status from a single view.
If you want to learn more about Spacelift, create a free account or book a demo with one of our engineers.
Key points
Observability tools play a critical role in modern infrastructure by providing end-to-end visibility across applications, services, and infrastructure layers. They help teams quickly identify root causes, reduce mean time to resolution (MTTR), and proactively prevent incidents before they impact users.
Investing in a strong observability strategy supports better performance, smoother deployments, and more confident scaling. For any organization running distributed or cloud-native systems, observability tools are essential for maintaining reliability, performance, and business continuity.
Solve your infrastructure challenges
Spacelift is a flexible orchestration solution for IaC development. It delivers enhanced collaboration, automation, and controls to simplify and accelerate the provisioning of cloud-based infrastructures.
Frequently asked questions
What are the 4 pillars of observability?
Many teams talk about three core pillars of observability, which are metrics, logs, and traces, with events often treated as a fourth signal that adds important context, for example deployments or configuration changes. These data types provide complementary insights into system behavior and help diagnose performance and reliability issues.
Why do I need observability tools instead of just monitoring?
Observability tools provide deeper, real-time insight into system behavior, while monitoring tools typically focus on predefined metrics and alerting. Observability enables teams to diagnose why something is broken, not just that it is.
Which observability tools are recommended for Kubernetes?
Prometheus, Grafana, Loki, and Jaeger are among the most recommended observability tools for Kubernetes environments. This combination provides a comprehensive observability stack covering metrics, logs, and traces, all with strong support for Kubernetes-native workflows, and is often combined with OpenTelemetry for standardized instrumentation in Kubernetes.
How do observability tools improve DevOps workflows?
By reducing the mean time to detection (MTTD) and mean time to resolution (MTTR), observability enhances system reliability and team productivity. It also supports proactive performance optimization and smoother incident management, aligning closely with DevOps goals.
