
In this article, we will see how to use the cloud-based monitoring and analytics platform Datadog with Terraform. We will look at a few examples of how to create Datadog monitors and monitor automation using Terraform, and the Terraform datadog provider options.
We will cover:
What is Datadog?
Datadog is a cloud-based monitoring and analytics platform offering real-time observability across infrastructure, applications, and logs. It enables organizations to monitor performance, collect data from various sources, set alerts, visualize data, and collaborate. Datadog supports APM, tracing, and security monitoring, helping companies of all sizes and industries enhance operations, troubleshoot issues, and optimize performance.
What is the Terraform Datadog provider?
Terraform Datadog provider lets you create and manage Datadog resources, such as monitors, dashboards, and alerts, using Terraform configuration files. This provider helps automate Datadog setup and management alongside other infrastructure resources to simplify the infrastructure monitoring process. By incorporating Datadog into your IaC workflow, you can ensure consistent, version-controlled monitoring across your entire stack.
To use the datadog provider, you first need to set up your Datadog API credentials. You’ll need to provide your Datadog API key and application key to Terraform to authenticate. You can do this by setting environment variables or by adding them to your Terraform configuration file.
If you don’t know your API key, see your Datadog account settings and create an application key on the same page if you don’t already have one.
provider "datadog" {
  api_key = var.datadog_api_key
  app_key = var.datadog_app_key
}
Why use Terraform to create Datadog monitors?
Using Terraform to create Datadog monitors leverages the benefits of Infrastructure as Code (IaC), including version-controlled configurations, improved observability, automation, and consistency. Terraform’s scalability also enables seamless integration of Datadog configurations with other infrastructure components.
One of the major advantages of managing your Datadog deployment with Terraform is the enhanced infrastructure drift detection. When you run a terraform plan or terraform apply, Terraform can detect any manual changes in your Datadog infrastructure that are not defined in your code. This helps maintain your infrastructure in the desired state and makes it easier to identify and correct any configuration issues.
Read more about managing Infrastructure as Code (IaC) with Terraform.
How to manage Datadog resources with Terraform?
To use Terraform for managing Datadog resources, follow the steps below:
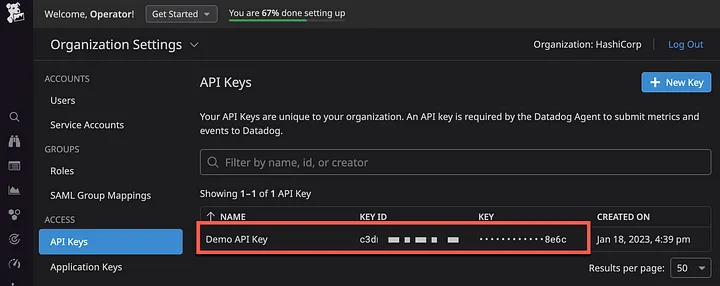
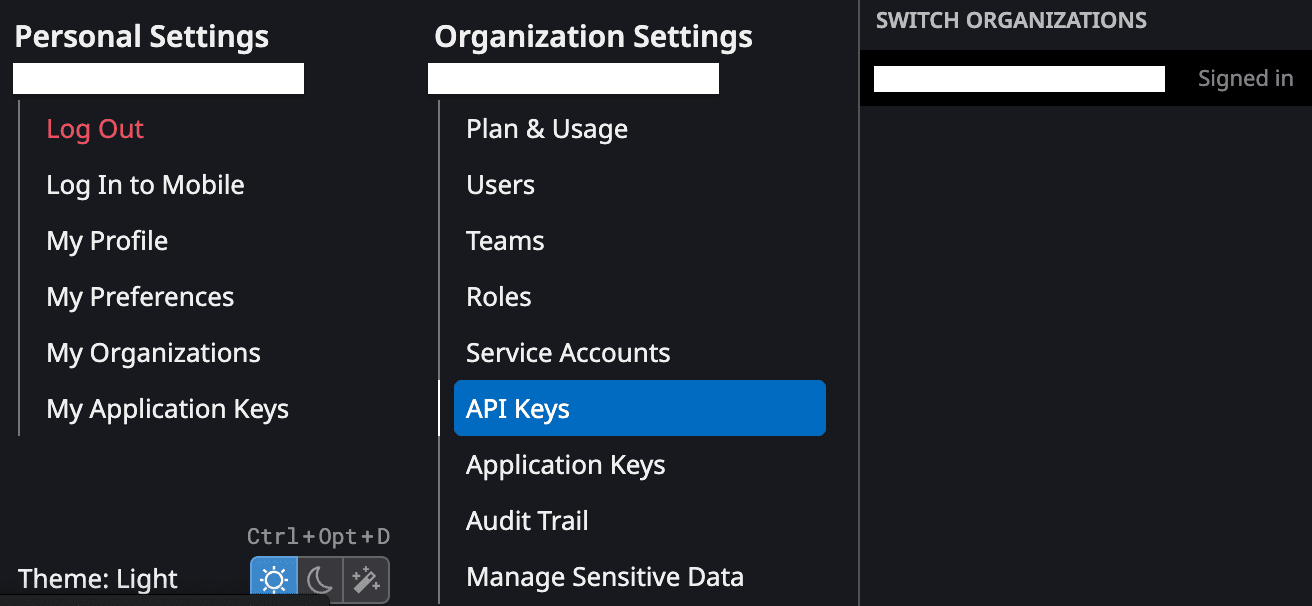
1. Obtain your API key
Go to your profile in the left bottom corner and select API keys:
This will redirect you to a screen in which you can copy this key:
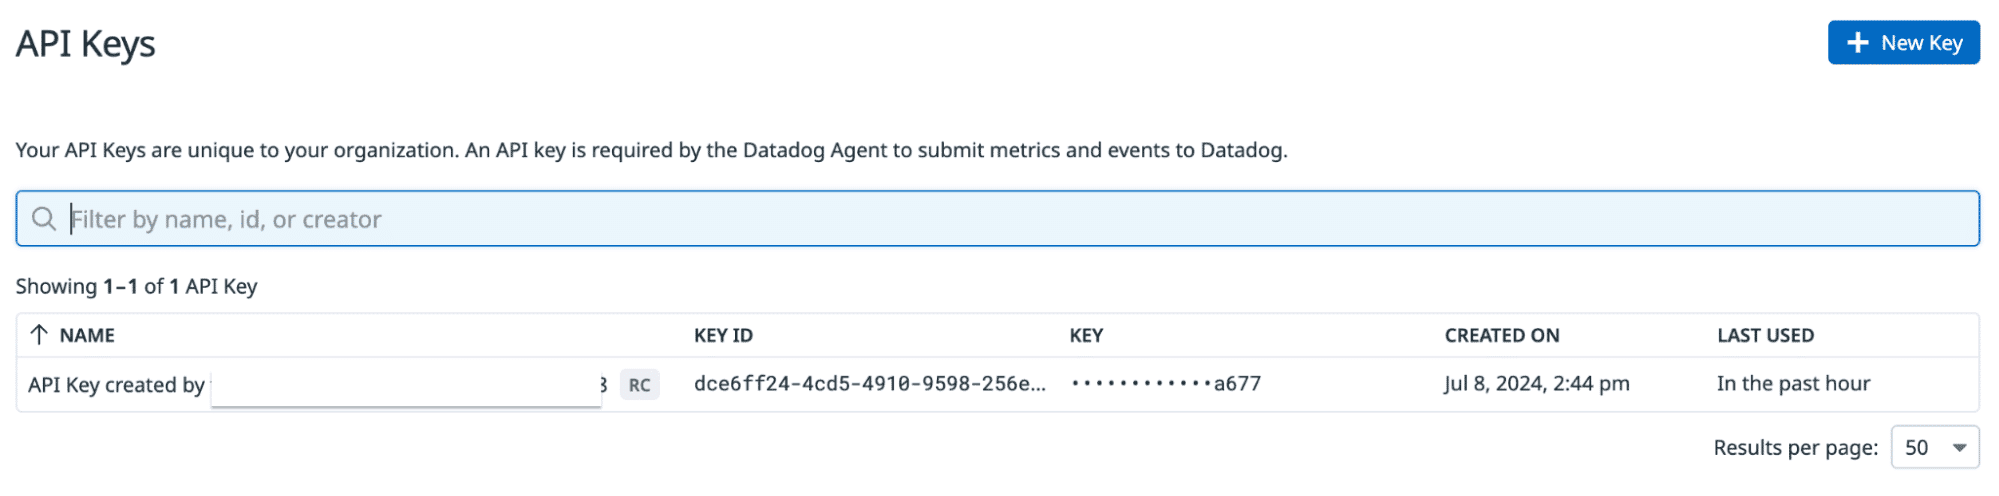
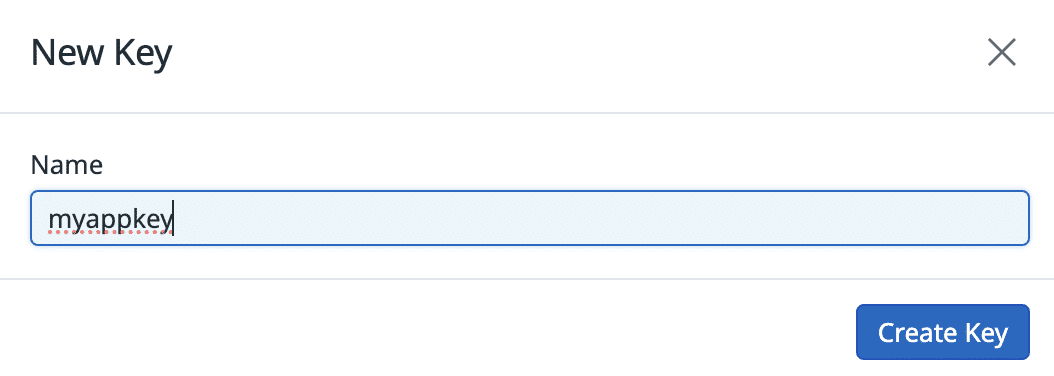
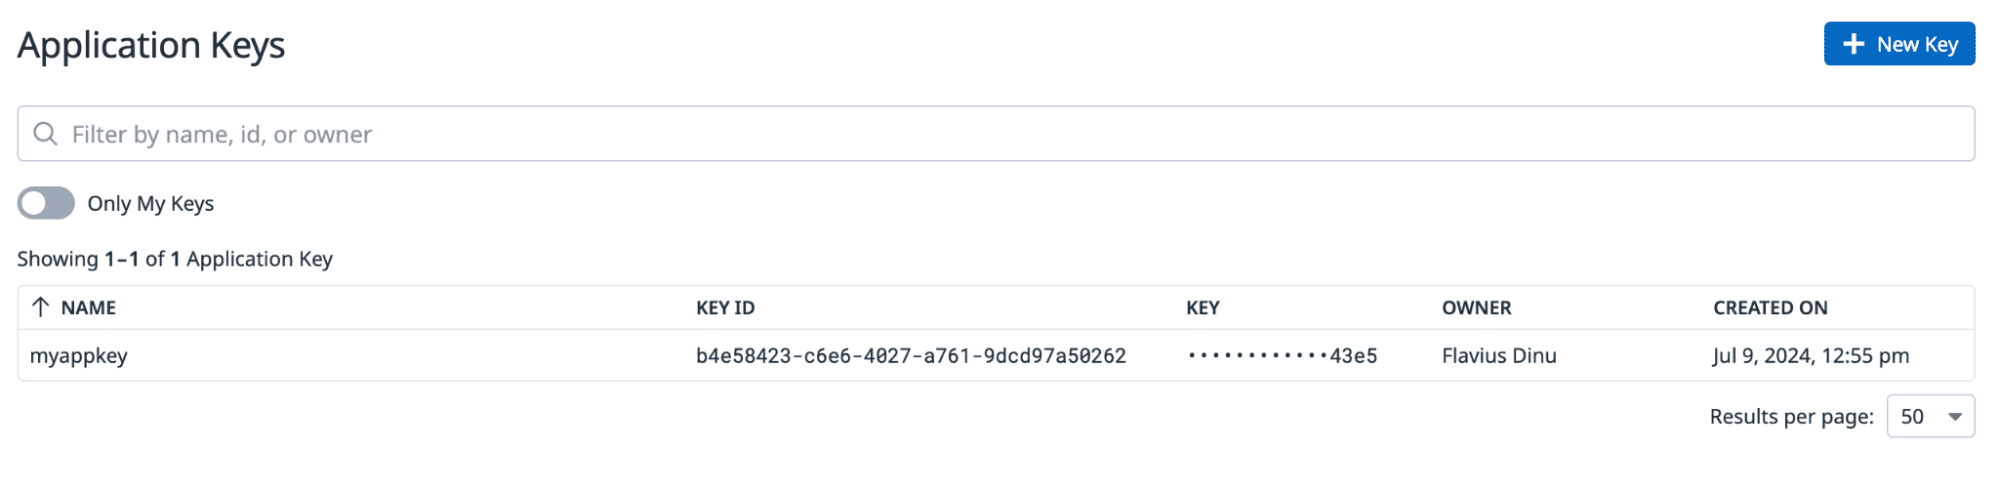
2. Create an Application Key
We will follow the steps from before, but instead of API Keys, select Application keys and create a new Datadog app key:
3. Configure the Terraform Datadog provider
Next, in your Terraform configuration file, prepare the Terraform provider and the Terraform block:
terraform {
 required_providers {
   datadog = {
     source = "DataDog/datadog"
   }
 }
}

provider "datadog" {
 api_key = var.datadog_api_key
 app_key = var.datadog_app_key
 api_url = "https://api.datadoghq.eu/"
}
Set the api_url variable as described in the provider documentation. Add values to the provider variables as described in step 1 and step 2.
4. Create a Datadog dashboard
resource "datadog_dashboard" "example_dashboard" {
 title       = "Example Dashboard"
 description = "A sample dashboard for monitoring an Ubuntu VM"
 layout_type = "ordered"
 widget {
   timeseries_definition {
     request {
       formula {
         formula_expression = "my_query_1 + my_query_2"
         alias              = "my ff query"
       }
       formula {
         formula_expression = "my_query_1 * my_query_2"
         limit {
           count = 5
           order = "desc"
         }
         alias = "my second ff query"
       }
       query {
         metric_query {
           data_source = "metrics"
           query       = "avg:system.cpu.user{app:general} by {env}"
           name        = "my_query_1"
           aggregator  = "sum"
         }
       }
       query {
         metric_query {
           query      = "avg:system.cpu.user{app:general} by {env}"
           name       = "my_query_2"
           aggregator = "sum"
         }
       }
     }
   }
 }
}
5. Run terraform init
terraform init

Initializing the backend...

Initializing provider plugins...
- Finding latest version of datadog/datadog...
- Installing datadog/datadog v3.40.0...
- Installed datadog/datadog v3.40.0 (signed by a HashiCorp partner, key ID FB70BE941301C3EA)

Partner and community providers are signed by their developers.
If you'd like to know more about provider signing, you can read about it here:
https://www.terraform.io/docs/cli/plugins/signing.html

Terraform has created a lock file .terraform.lock.hcl to record the provider
selections it made above. Include this file in your version control repository
so that Terraform can guarantee to make the same selections by default when
you run "terraform init" in the future.

Terraform has been successfully initialized!

You may now begin working with Terraform. Try running "terraform plan" to see
any changes that are required for your infrastructure. All Terraform commands
should now work.

If you ever set or change modules or backend configuration for Terraform,
rerun this command to reinitialize your working directory. If you forget, other
commands will detect it and remind you to do so if necessary.
6. Run terraform apply
Plan: 1 to add, 0 to change, 0 to destroy.
Do you want to perform these actions?
Terraform will perform the actions described above.
Only 'yes' will be accepted to approve.
Enter a value: yes
datadog_dashboard.example_dashboard: Creating...
datadog_dashboard.example_dashboard: Creation complete after 1s [id=zrq-mmp-f53]
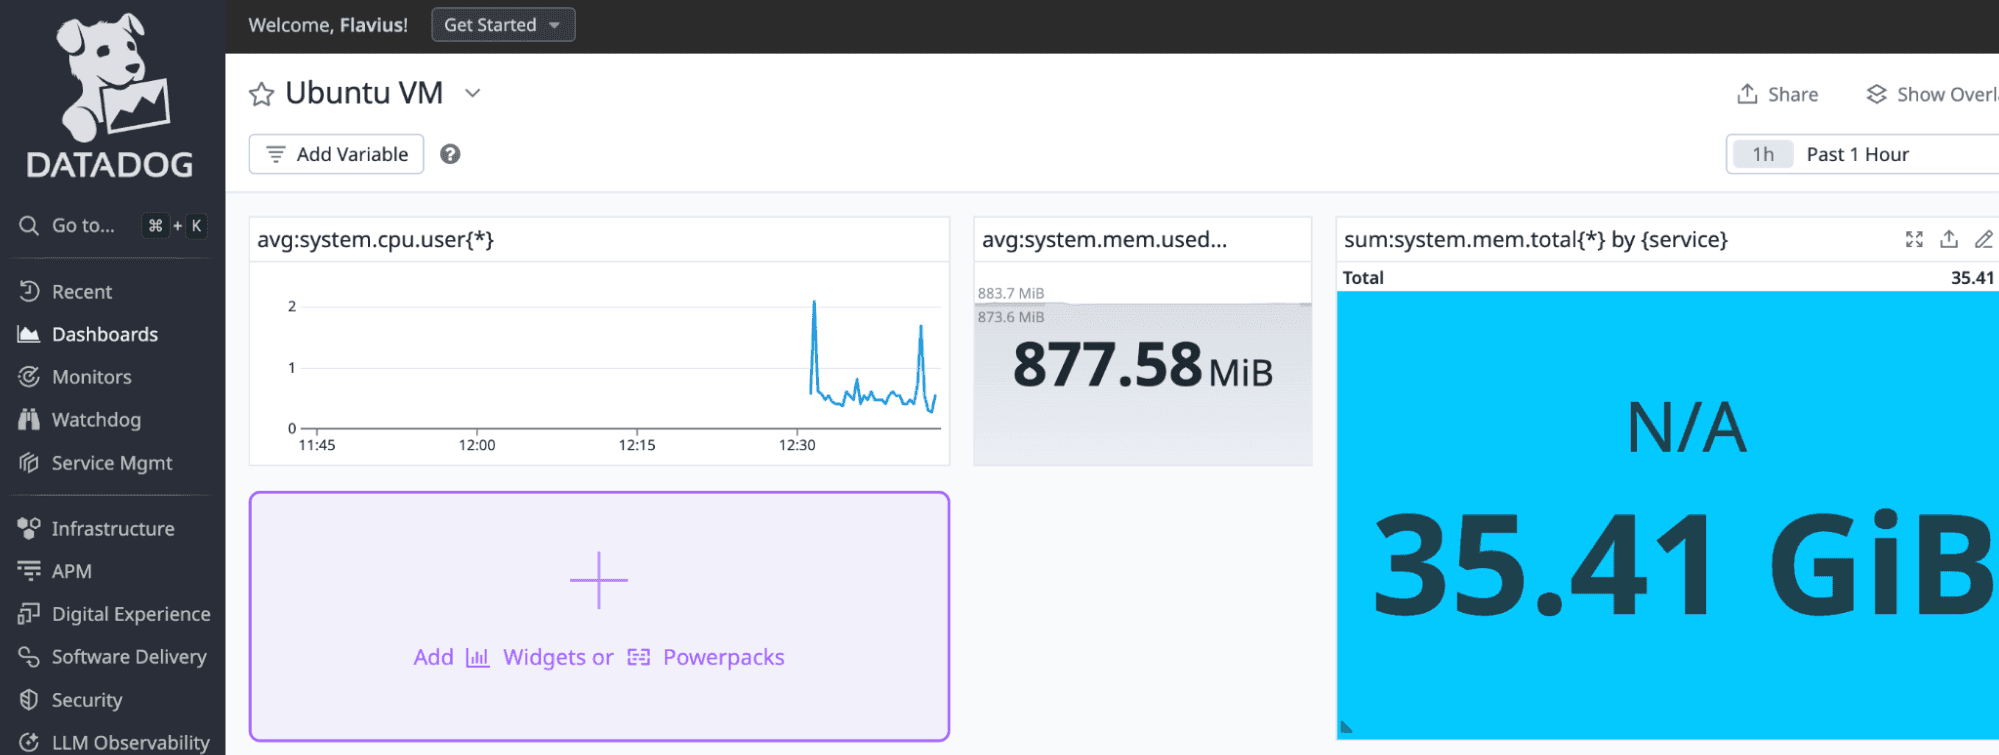
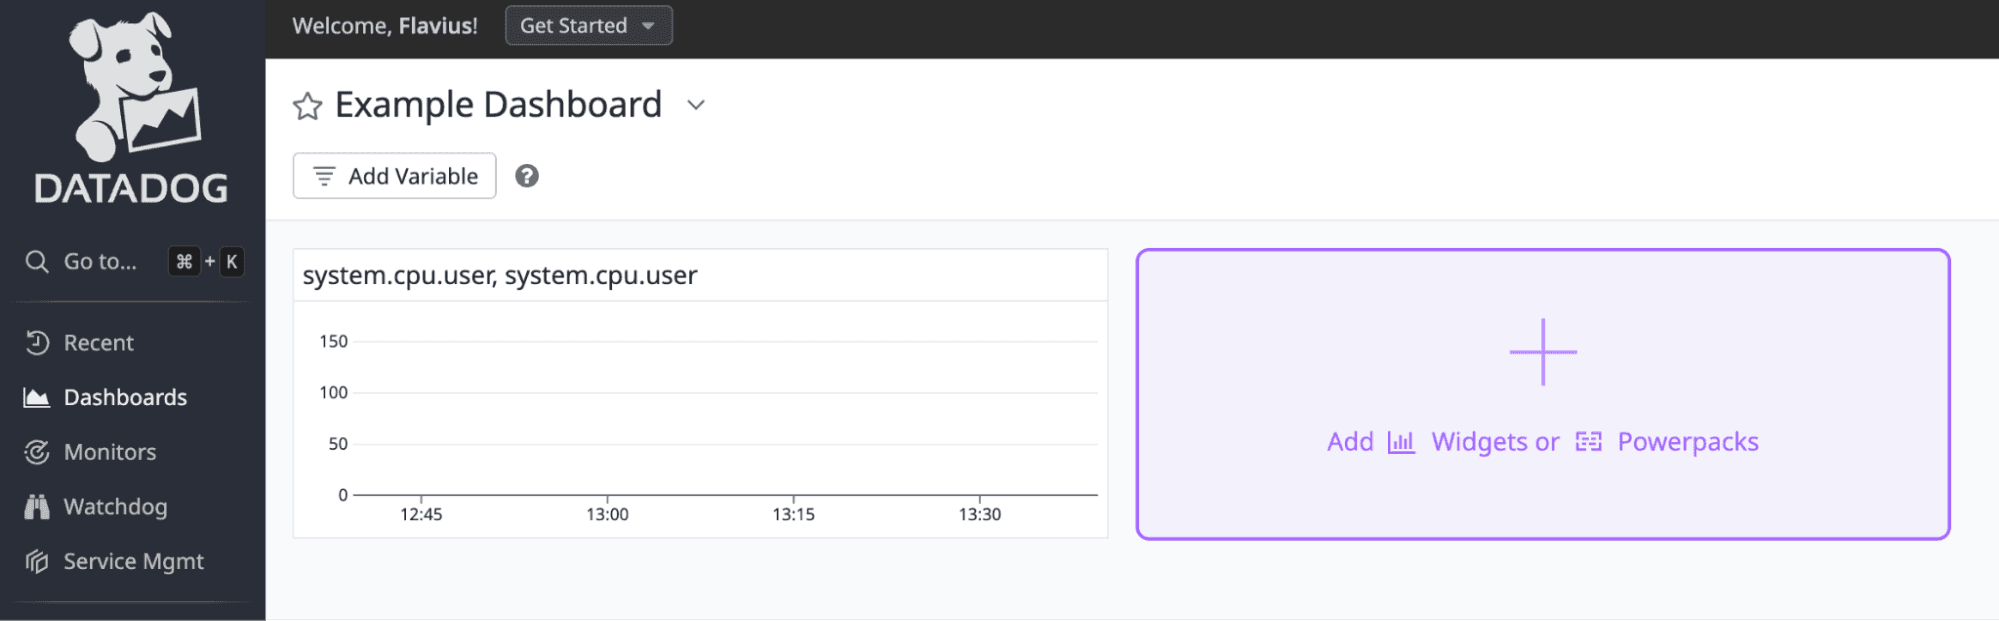
Apply complete! Resources: 1 added, 0 changed, 0 destroyed.7. Review the Datadog dashboard
Examples: Using Terraform to automate Datadog monitors
Let’s look at some real-life practical examples that demonstrate how to use the Datadog Terraform provider to set alerts that will be used to monitor various resources on the Microsoft Azure cloud.
Example 1 – Terraform Datadog example to monitor an Azure Web App
In this example, a metric alert is configured to query the web app CPU threshold and raise an alert should it exceed the critical threshold set at 80%.
resource "datadog_monitor" "webapp_cpu_monitor" {
  name        = "Azure Web App CPU Usage"
  type        = "metric alert"
  message     = "The CPU usage of the Azure Web App has exceeded the threshold."
  query       = "max:azure.webapp.cpu{*} by {app_name} > 80"
  monitor_thresholds {
    critical = 80
  }
  notify_no_data = true
  no_data_timeframe {
    minutes = 15
  }
  tags = [
    "environment:production",
    "application:azure_webapp"
  ]
}
The no-data timeframe is also set to 15 minutes, which means that if no data is received for the monitor within this timeframe, an alert will trigger (this might mean the web app has gone offline).
Example 2 – Terraform Datadog example to monitor an Azure Storage Account
Similar to the previous example, here we set a metric alert to detect when the space left in the Azure storage account is less than 20%.
resource "datadog_monitor" "storage_account_monitor" {
  name        = "Azure Storage Account Available Space"
  type        = "metric alert"
  message     = "The available space in the Azure Storage Account has fallen below the threshold."
  query       = "100 - max:azure.storage_account.percent_used_space{*} by {account_name} < 20"
  monitor_thresholds {
    critical = 20
  }
  notify_no_data = true
  no_data_timeframe {
    minutes = 15
  }
  tags = [
    "environment:production",
    "application:azure_storage_account"
  ]
}
Example 3 – Terraform Datadog example to monitor an Azure AKS cluster and trigger autoscaling
In this example, we use the Terraform Datadog provider to monitor when the AKS cluster CPU usage goes over 80% and directly trigger the cluster to autoscale. The resource azurerm_monitor_autoscale_setting includes a profile block, which includes a set of autoscaling rules set in the autoscale_rules variable.
resource "datadog_monitor" "aks_cpu_monitor" {
  name        = "AKS CPU Usage"
  type        = "metric alert"
  message     = "The CPU usage of the AKS cluster has exceeded the threshold. Scaling up the cluster."
  query       = "max:kubernetes.container.cpu.usage.total{namespace=\"default\",pod!=\"\",image!=\"\"} by {pod} > 80"
  monitor_thresholds {
    warning = 70
    critical = 80
  }
  notify_no_data = true
  no_data_timeframe {
    minutes = 15
  }
  tags = [
    "environment:production",
    "application:aks_cluster"
  ]
}

resource "azurerm_kubernetes_cluster" "aks_cluster" {
  name                = "my-aks-cluster"
  location            = "uksouth"
  resource_group_name = "my-resource-group"
  dns_prefix          = "my-aks-cluster"
  agent_pool_profile {
    name            = "agentpool"
    count           = 3
    vm_size         = "Standard_DS2_v2"
    os_type         = "Linux"
    os_disk_size_gb = 30
  }
  service_principal {
    client_id     = var.client_id
    client_secret = var.client_secret
  }
  tags = {
    Environment = "production"
    Application = "aks_cluster"
  }
}

resource "azurerm_monitor_autoscale_setting" "aks_cluster_autoscale" {
  name                = "aks_cluster_autoscale"
  resource_group_name = azurerm_kubernetes_cluster.aks_cluster.resource_group_name
  location            = azurerm_kubernetes_cluster.aks_cluster.location
  target_resource_id  = azurerm_kubernetes_cluster.aks_cluster.id

  profile {
    name  = "aks_cluster_autoscale_profile"
    rules = jsonencode(var.autoscale_rules)
  }
}

variable "autoscale_rules" {
  type    = any
  default = [
    {
      "metricTrigger" : {
        "metricName" : "CpuPercentage",
        "metricNamespace": "",
        "metricResourceUri": "${azurerm_kubernetes_cluster.aks_cluster.id}/namespaces/default/pods",
        "timeGrain": "PT1M",
        "statistic": "Average",
        "timeWindow": "PT10M",
        "timeAggregation": "Average",
        "operator": "GreaterThan",
        "threshold": 80
      },
      "scaleAction": {
        "direction": "Increase",
        "type": "ChangeCount",
        "value": "1",
        "cooldown": "PT10",
      }
   ]
If you are using the examples for testing, once you have deployed the Datadog monitors and Azure resources, be sure to clean them up using terraform destroy. (Read more about destroying Terraform resources.)
Best practices for Datadog Terraform
All Terraform best practices apply to the Datadog provider as well. Below are some of them:
- Always use version control for your Terraform code to track changes, collaborate with team members, and roll back to previous versions if needed.
- Integrate Terraform with your CI/CD pipelines to automate the deployment and management of Datadog resources. This ensures that changes are tested and deployed consistently across environments.
- Check the official Datadog and Terraform documentation regularly for updates and best practices. Both platforms are under active development, so it’s important to stay informed about new features and improvements.
See the top 20 Terraform best practices to ensure a good Terraform workflow.
Managing Terraform and Datadog with Spacelift
Spacelift can send data to Datadog to help you monitor your infrastructure and Spacelift stacks using Datadog’s excellent monitoring and analytics tools. Our integration with Datadog focuses primarily on runs and lets you create dashboards and alerts to answer questions like:
- How many runs are failing?
- Which stacks see the most activity?
- How long does it take to plan a given stack?
- How long does it take to apply a stack?
- What is the load on my Spacelift private workers?
- How many resources am I changing?
- …and many more!
Let’s reuse the example we’ve built previously. We will remove the app key and API key from the configuration and create a context with these values as environment variables to easily reuse the configuration for other Datadog stacks.
To create the context, log in to your Spacelift account, select contexts, and create a new context:
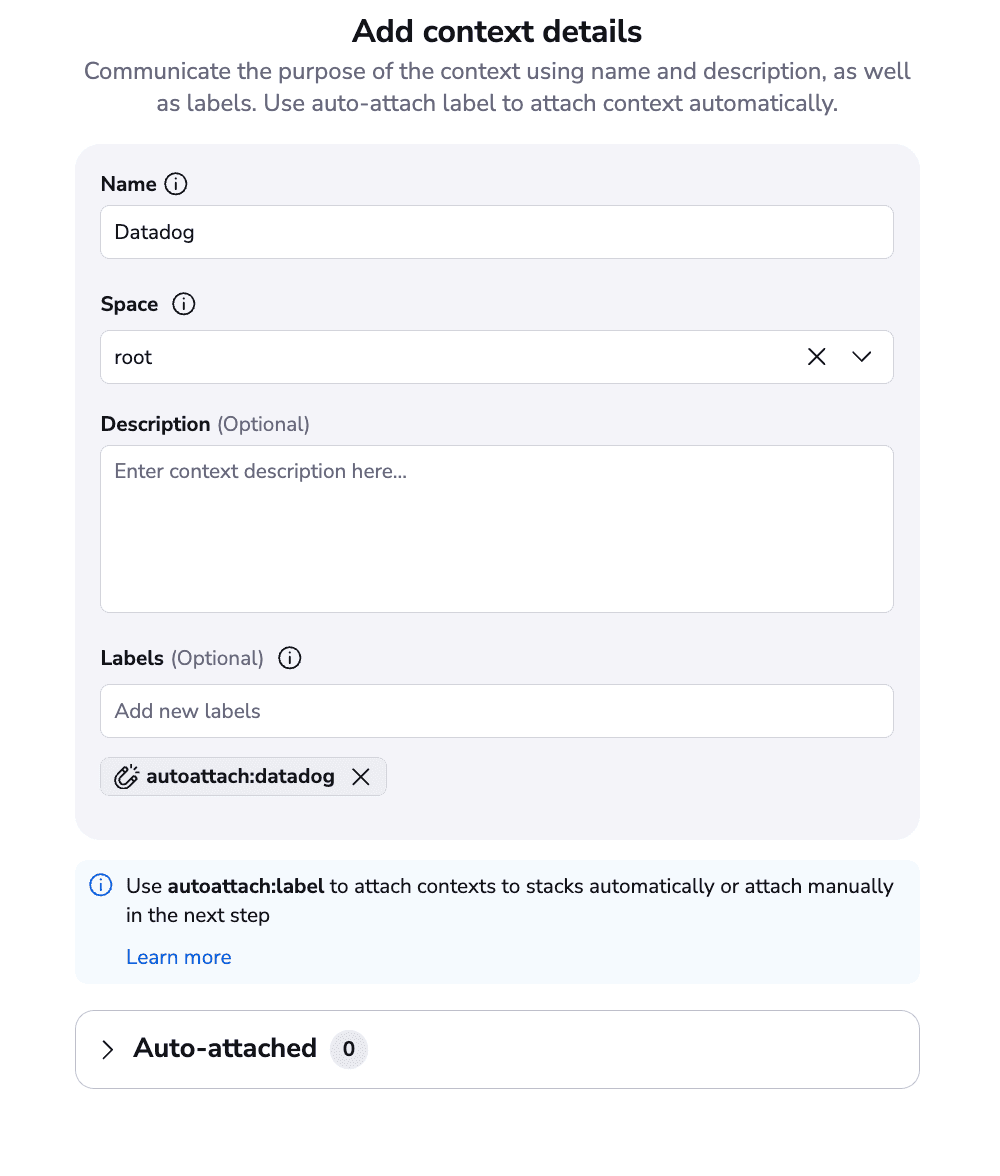
We will use the autoattach:datadog label, so for each stack that has a datadog label, this context will be automatically attached.
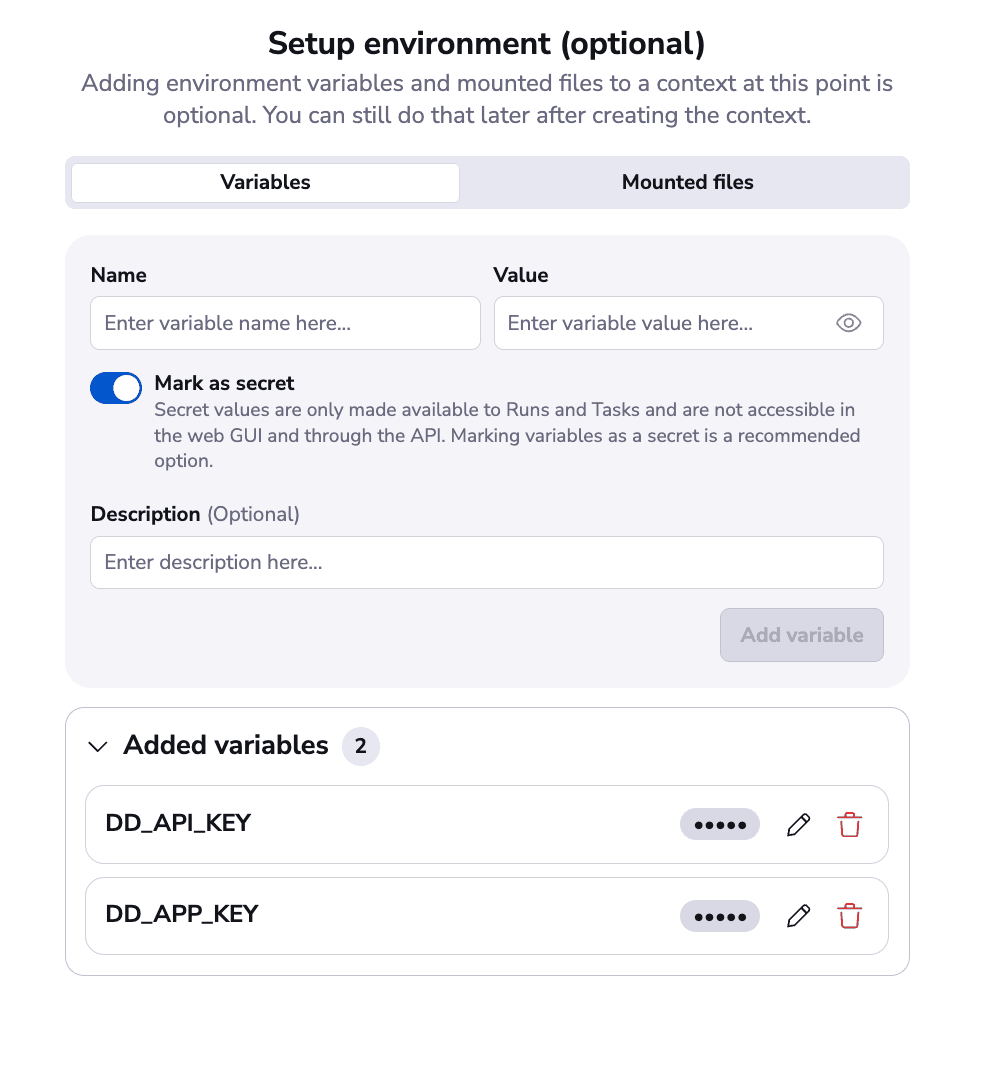
The variables should have exactly these names so that the Terraform provider can leverage them automatically. Add the values specific to your environment.
Now, after we have created the context, let’s create a stack:
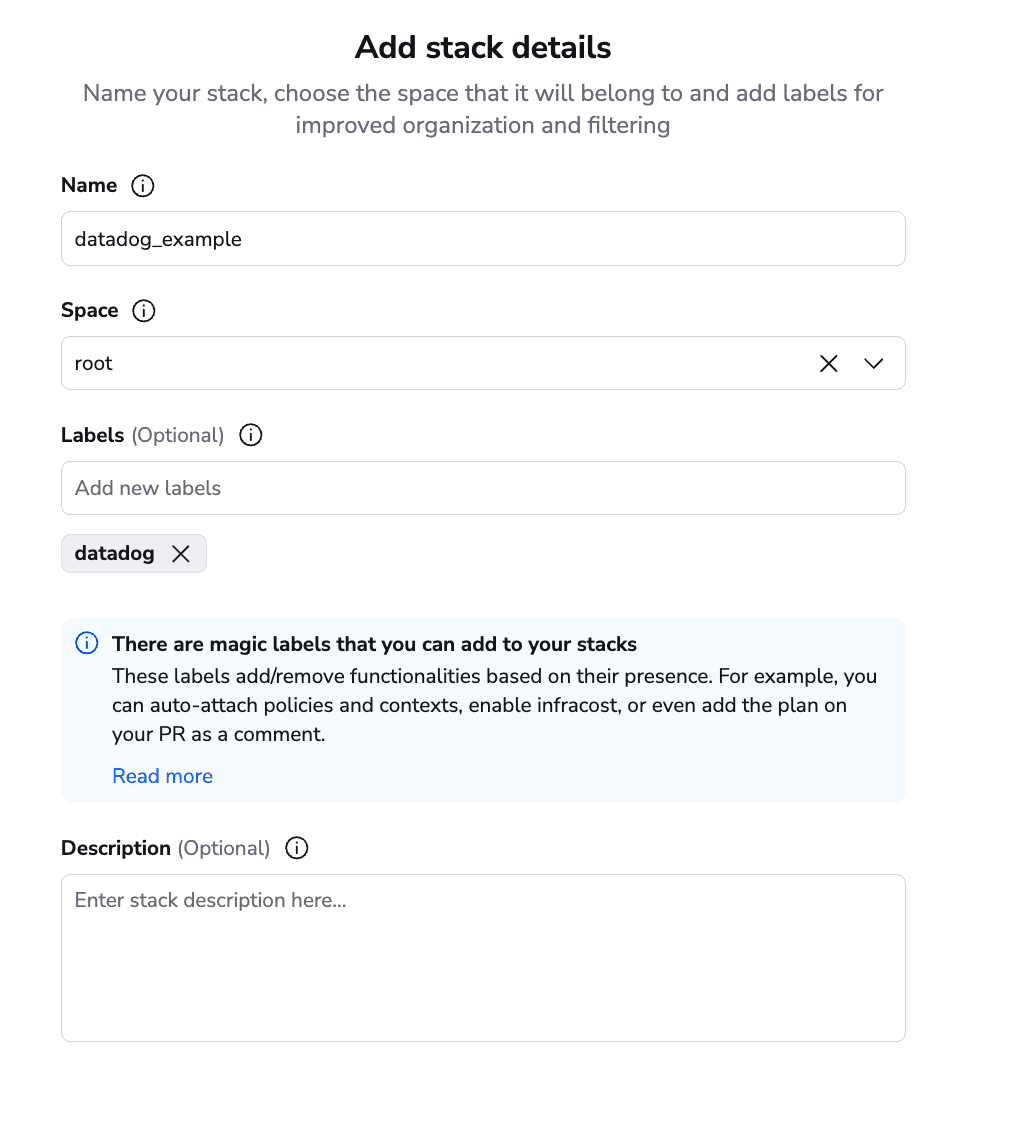
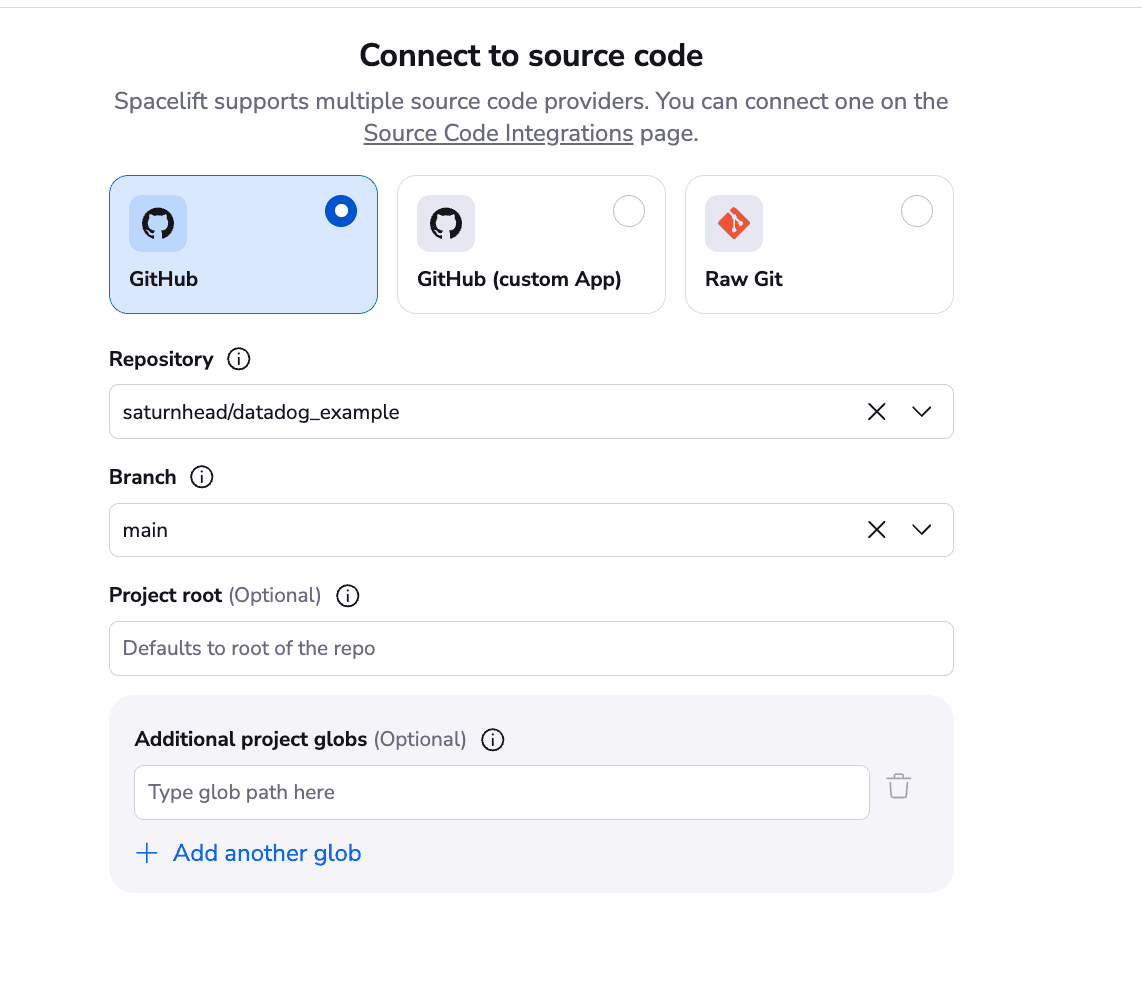
Add the Datadog label to ensure the context we’ve created is auto-attached. In the next step, select your VCS repository.
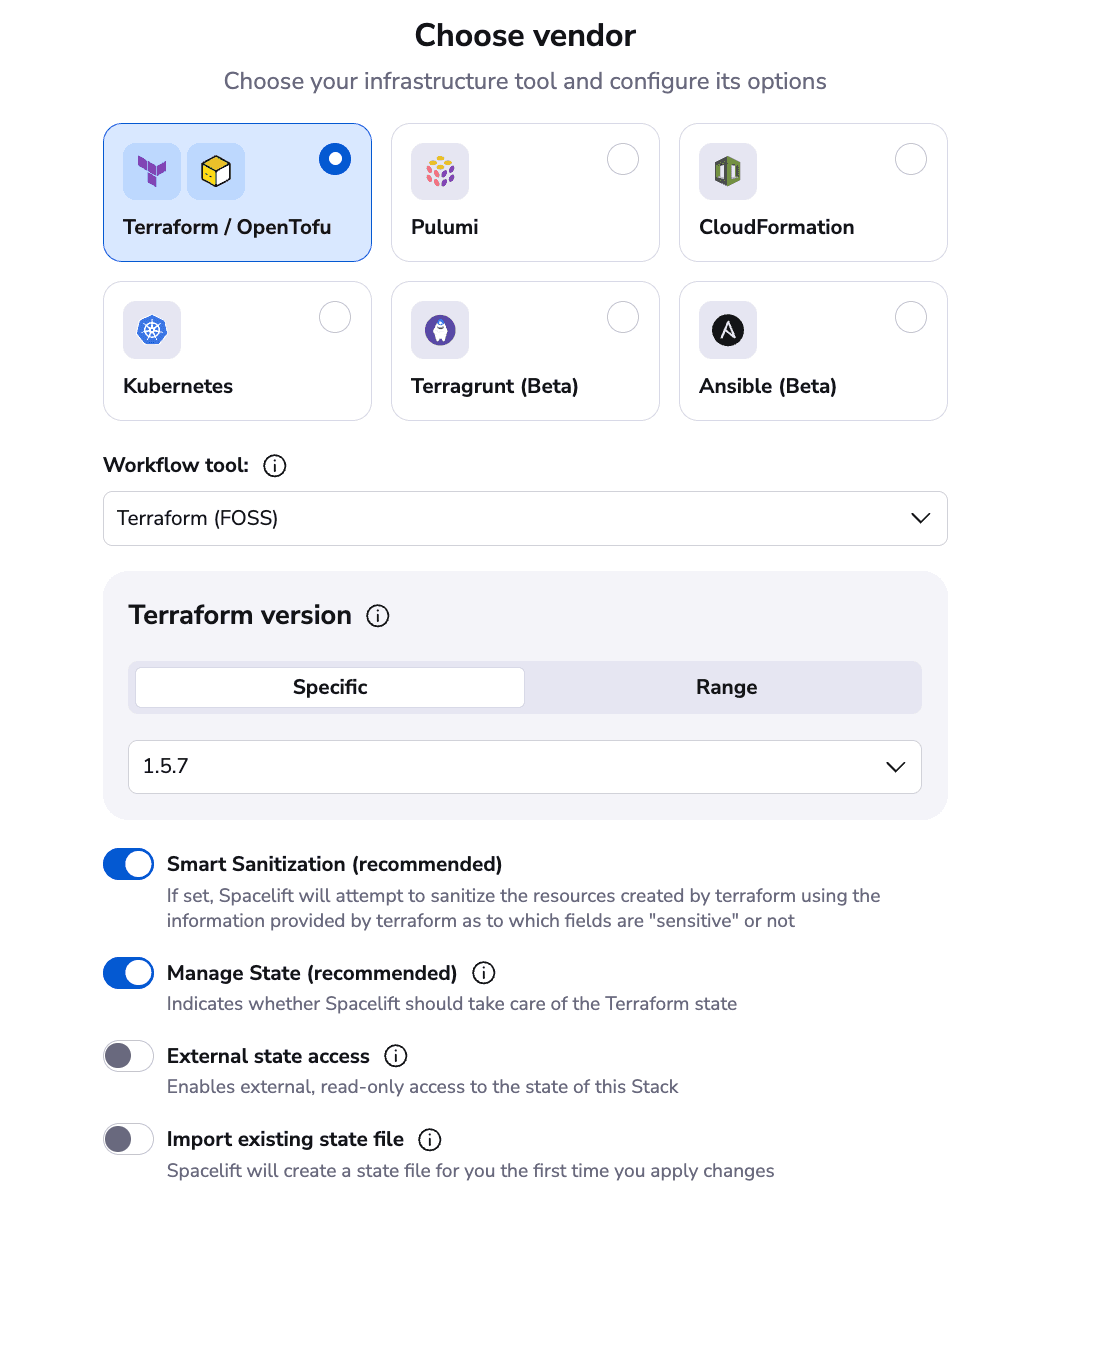
Accept the vendor defaults:
Finally, go to the contexts tab to see if the context has been auto-attached:
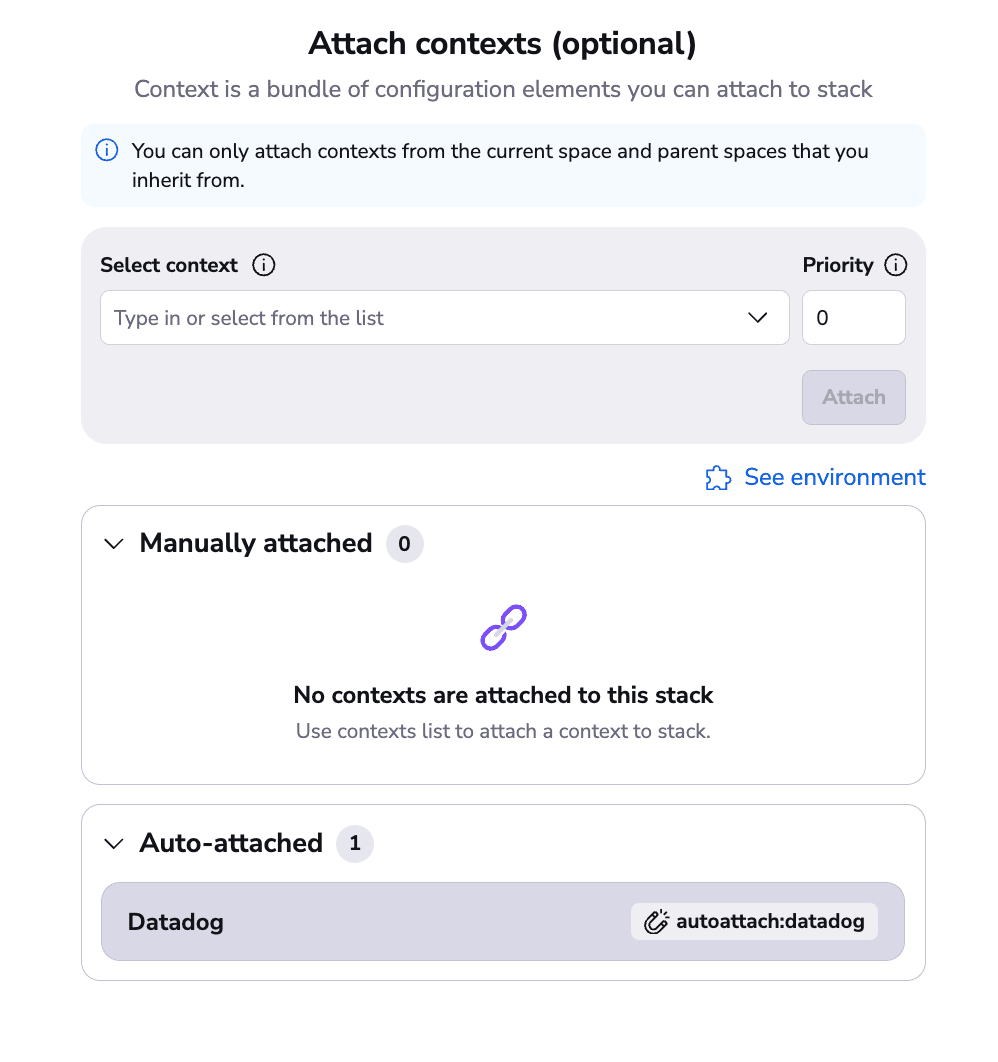
As you can see, the context has been automatically attached.
Now, let’s run the stack:
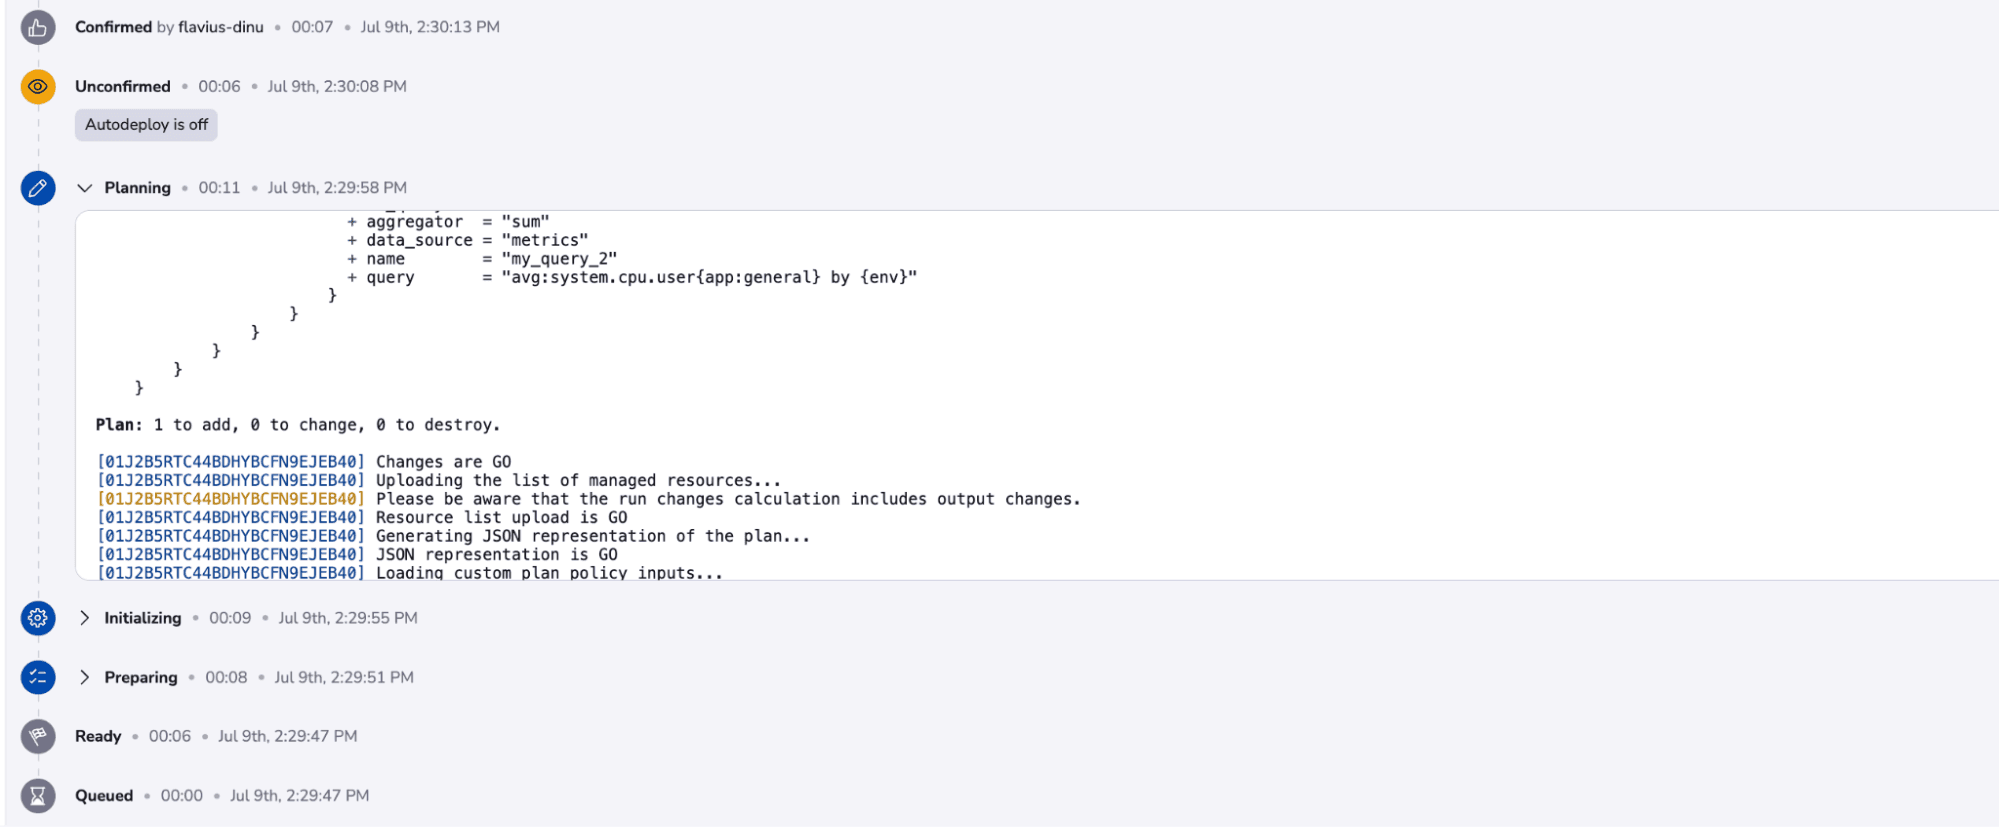
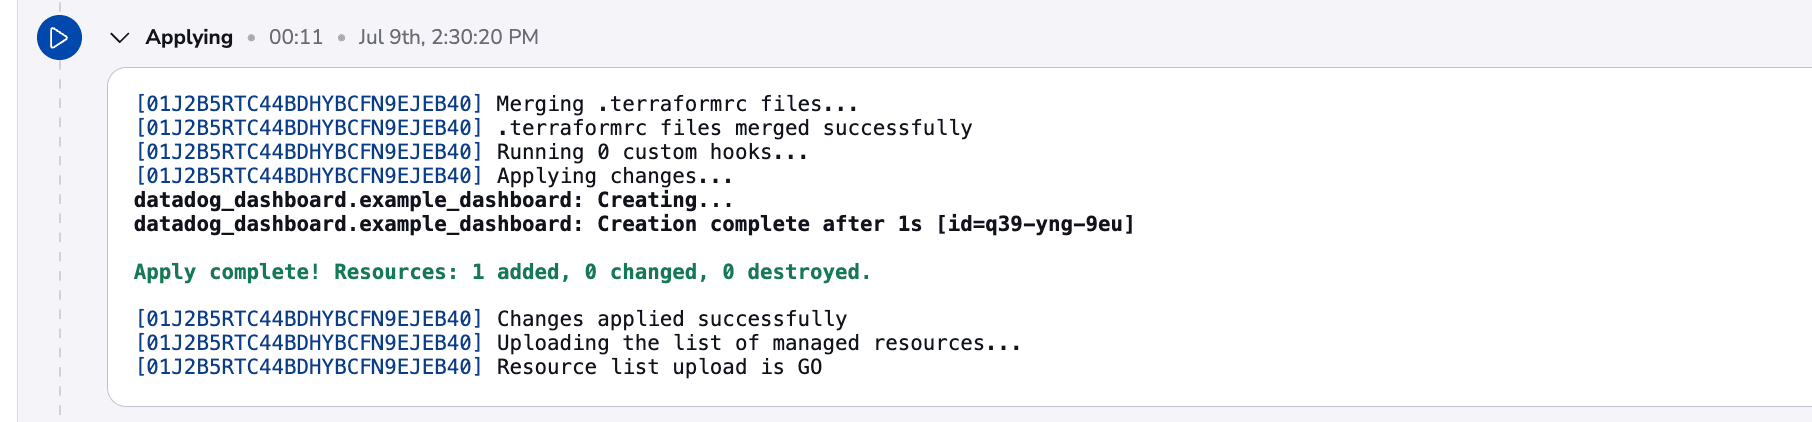
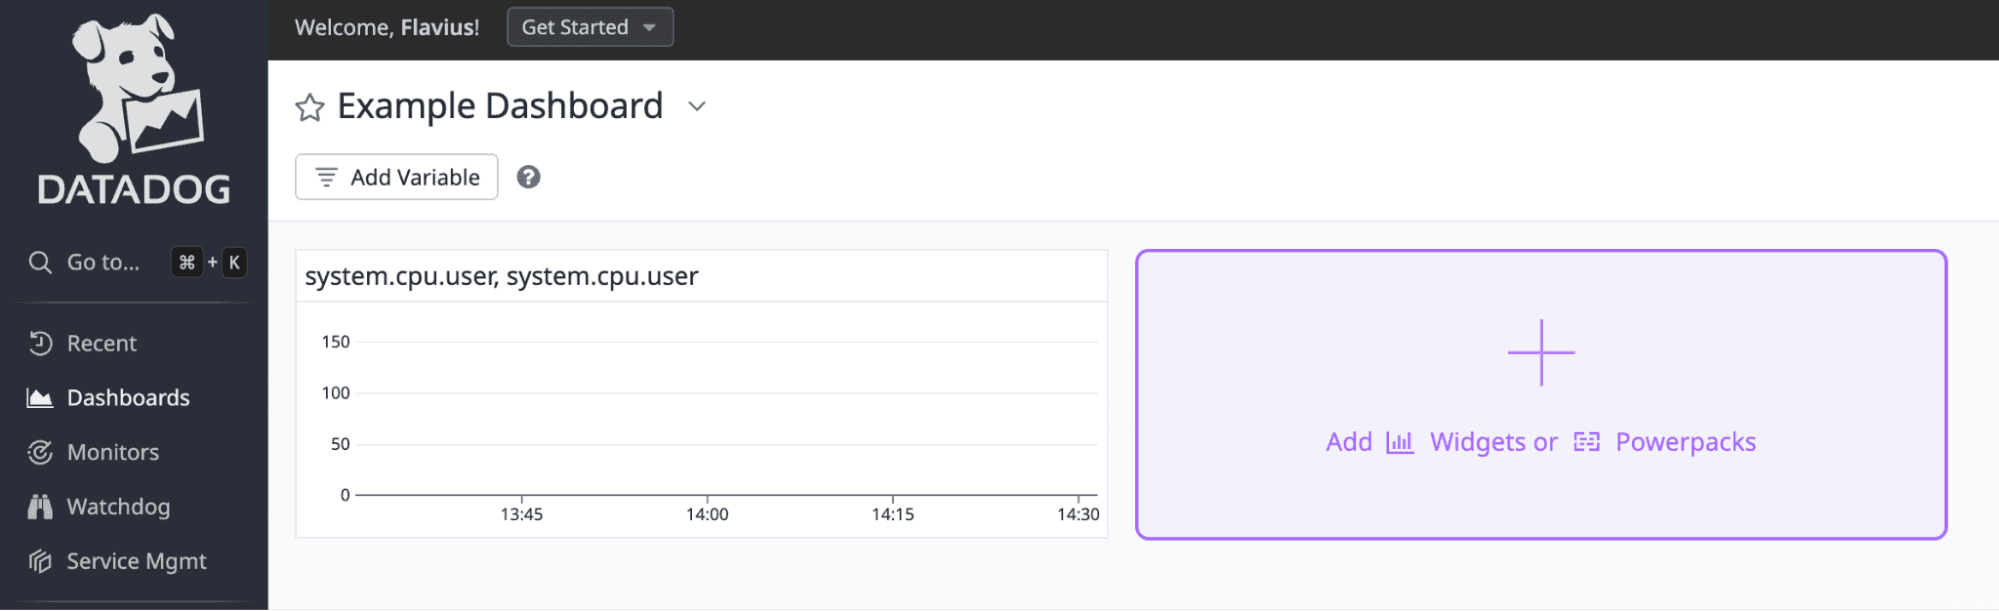
The apply finished successfully. If we go back to our Datadog account, we can see the dashboard created once again:
Key points
Terraform can be used with hundreds of providers, including popular cloud services such as AWS, Azure, and GCP, and widely used services such as Kubernetes, VMWare, and Datadog. Integrating Datadog into the infrastructure provisioning process using the Datadog provider can be used to create and manage Datadog resources such as monitors, bringing all the benefits of infrastructure as code to your Datadog deployment.
And explore how Spacelift makes it easy to work with Terraform. If you need any help managing your Terraform infrastructure, building more complex workflows based on Terraform, and managing AWS credentials per run, instead of using a static pair on your local machine, Spacelift is a fantastic tool for this. It supports Git workflows, policy as code, programmatic configuration, context sharing, drift detection, and many more great features right out of the box.
If you want to learn more about Spacelift, create a free account today, or book a demo with one of our engineers.
Note: New versions of Terraform are placed under the BUSL license, but everything created before version 1.5.x stays open-source. OpenTofu is an open-source version of Terraform that expands on Terraform’s existing concepts and offerings. It is a viable alternative to HashiCorp’s Terraform, being forked from Terraform version 1.5.6.
Terraform Management Made Easy
Spacelift effectively manages Terraform state, more complex workflows, supports policy as code, programmatic configuration, context sharing, drift detection, resource visualization and includes many more features.
Terraform Registry. Datadog Provider. Accessed: 21 October 2025
Datadog Docs. Getting Started in Datadog. Accessed: 21 October 2025
