
Observability is the process of learning a system’s internal state. Observable systems provide metrics, logs, and traces that let you inspect what’s happening inside them. This data simplifies debugging, but it presents practical challenges: It’s difficult to filter, process, and store the huge volumes of data that busy systems create.
Observability pipelines solve this problem. They’re specialized workflows for gathering and formatting the data emitted by your systems. Pipelines make it easier to utilize captured data, allowing you to focus on analyzing the insights within.
This article provides an overview of the benefits of observability pipelines and use cases. We’ll share tips for building optimized pipelines and discuss best practices for success at scale. Let’s begin with a closer look at what observability pipelines do.
What is an observability pipeline?
An observability pipeline is an automated process that collects, formats, and stores observability data. It prepares data from multiple sources ready to be used in real-world monitoring workflows. The pipeline lets you add missing context and address inconsistencies in the source data.
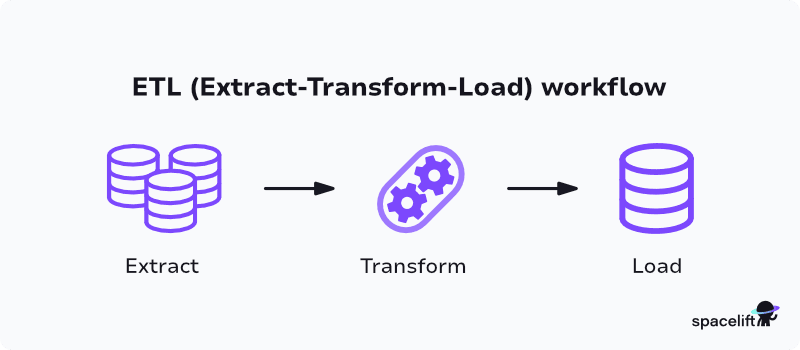
Observability pipelines comprise several different components. The tools work together to implement an ETL (Extract-Transform-Load) workflow:
- Extract: First, a collector like OpenTelemetry Collector extracts the observability data from your systems by regularly scraping available metrics, logs, and traces.
- Transform: Next, a processing layer transforms the raw data by filtering, normalizing, and reformatting it. Many collectors include built-in processing features, but standalone tools can also be used. Common processing tasks include masking PII, adding contextually relevant tags, and standardizing log message structures.
- Load: After transformation, the cleaned data is aggregated and then sent to persistent storage like Elasticsearch for long-term retention. Once stored, the data is indexed for easy searchability.
When it emerges from the pipeline, your observability data is neatly organized, ready for efficient analysis. You can then connect visualization tools, such as Grafana to conveniently consume your data.
Observability use cases
Observability pipelines’ primary use cases involve improving data control, reducing observability costs, and enhancing system performance insights:
- Data reduction and filtering: Downsampling or dropping high-volume, low-value telemetry before it reaches storage tools to lower ingestion costs
- Format transformation: Converting data formats (e.g., from proprietary log formats to OpenTelemetry) to maintain compatibility across tools
- Routing to multiple destinations: Sending different types of data to specialized tools (e.g., logs to Splunk, metrics to Prometheus, traces to Jaeger) for optimized analysis
- Enrichment: Adding metadata (e.g., Kubernetes labels or cloud tags) to enhance context before ingestion by observability platforms
- Security and compliance: Scrubbing sensitive data (PII, secrets) before it reaches third-party monitoring or logging systems
Read more: What is Observability? Metrics, Logs & Traces Overview
How observability pipelines solve monitoring challenges
Observability pipelines address the challenges of handling observability data at scale. They enable you to build reliable, structured processes for collecting and manipulating your metrics, logs, and traces. This eliminates the coverage gaps, inconsistencies, and formatting issues that often prevent efficient data analysis.
Observability pipelines solve common monitoring challenges, including the following:
- Complex and unintuitive data analysis processes: Observability pipelines standardize data processing workflows to reduce complexity. All data passes through a consistent set of automated stages, helping minimize the amount of maintenance work required.
- Noise caused by excess data volumes: Large-scale systems such as microservices can rapidly generate huge data volumes, but most events aren’t relevant or actionable. Pipeline-based processing lets you cut through the noise by centrally configuring filters that eliminate unnecessary data. For instance, you could set up a transformation that drops or truncates messages from a particular third-party component used in your apps.
- Difficulty managing storage costs: The filtering features found in observability pipeline tools also help reduce waste. Cutting out noise reduces the data you have to store, letting you save costs.
- Too many separate data collection and processing systems: Using one consistent pipeline for your entire observability stack minimizes the number of tools and services you need to maintain. You can standardize how data is transformed and loaded, even when working with multiple data sources.
- Difficulty parsing and formatting data for analysis: Observability pipelines give you full control over your data. You can parse and reformat metrics using vendor-neutral approaches, making it easier to prepare data for use.
- Unable to consistently enforce security and compliance requirements: Centralizing observability data processing tasks in a single pipeline enables you to implement stronger compliance controls. Limiting the number of systems that data passes through reduces the risk of unintentional exposure.
By addressing these issues, observability pipelines enable you to fully utilize your collected data. The pipeline ensures all data is handled efficiently, from its source through to its final storage location. The ability to apply consistent real-time data transformations also makes it easier to focus on real insights even when working with very large data volumes.
How to build an observability pipeline
Building an observability pipeline requires five key steps:
Step 1: Define your monitoring aims.
Step 2: Identify the data sources you’ll need to monitor.
Step 3: Decide where data needs to be sent for querying and analysis.
Step 4: Design data transformations to manipulate, reformat, and cleanse raw values.
Step 5: Connect query and visualization solutions that let you analyze your data.
The process starts with defining your monitoring aims. For instance, you could be seeking to trace user actions, monitor service latency, and detect potential malicious activity. Different objectives influence the data you need to collect, so it is essential to have clear requirements.
Once you know your objectives, start mapping out your data flows. You need to identify where data originates and where it should be sent. This means listing all the systems you need to monitor to achieve your aims, along with the types of data each service exposes. You can then select storage solutions that’ll allow you to retain and analyze gathered data.
Alongside this work, you should implement the transformations that’ll turn your raw metrics into actionable information. Try to normalize any inconsistencies in collected data, such as some systems presenting the same metrics in different units.
Well-designed transformations make it much easier to analyze your data without requiring further manual processing. After transformation, you can use tools like Grafana to visualize your collected data and begin hunting for insights.
Observability pipeline tools
Your exact observability pipeline tools will depend on the types of systems you’re monitoring and the kinds of data they produce. Many popular tools support multiple functions, such as both extracting and transforming data, while some platforms implement an end-to-end pipeline within a single solution.
Popular observability pipeline tool choices include:
| Tool | Category | Primary purpose | Key features / Notes |
| OpenTelemetry Collector | Observability data collector & processor | Collect, transform, and export telemetry data (logs, metrics, traces) | Highly extensible, vendor-agnostic, supports many export formats |
| Fluentd | Log collector & processor | Unified log ingestion from many sources | Pluggable architecture with 500+ plugins; strong support for log routing & enrichment |
| Elasticsearch | Search engine & database | Store, index, and query structured & unstructured data | Commonly used for log storage; supports full-text search and analytics |
| Apache Kafka | Distributed event streaming platform | Handle high-volume real-time data streams | Durable, scalable messaging backbone for pipelines; often used to buffer observability data |
| Logstash | Data processing pipeline | Ingest, transform, and send data to destinations | Part of the Elastic Stack; strong log processing capabilities |
| Vector | Observability pipeline | Collect, transform, and route logs/metrics | High-performance, memory-safe (Rust), many built-in components; Datadog-backed |
| Grafana | Visualization & alerting | Visualize metrics/logs/traces; build dashboards | Works with many data sources; widely used for monitoring & alerting |
| Prometheus | Time-series database & monitoring system | Store and query metrics; scrape instrumented targets | Powerful query language (PromQL), huge ecosystem of exporters, widely adopted |
Although you should select the tools that work best in your own workflows, open, vendor-agnostic solutions are often the most effective choices in the long term.
Tools that can collate data from multiple cloud providers and hosting platforms make it simpler to standardize your processes. They also minimize the risk of vendor lock-in. However, commercial observability platforms may be easier to use, need less configuration, or offer cleaner integration with your existing tools.
Best practices for observability pipelines
Now that we’ve covered what observability pipelines are and how to build them, let’s wrap up with a quick summary of some best practices to keep in mind.
- Define clear data collection goals: Setting clear monitoring aims enables you to select data sources, tools, and transformations that support those goals. This helps avoid noise and can reduce implementation toil.
- Only capture data that provides actionable insights: There’s no point collecting data for the sake of it. Focus on the metrics, logs, and traces that provide actionable information relevant to your monitoring aims. Reducing the amount of data passing through your pipeline improves performance, efficiency, and scalability.
- Keep your data transformations small and simple: The ease with which you can apply transformations is one of the main benefits of observability pipelines. However, having too many complex transformations can degrade performance and make it harder to understand what’s happening in your pipeline.
- Standardize on a consistent set of tools: Using a single pipeline for all your observability needs makes it easier to draw insights across multiple data sources. It also reduces the effort required to connect new services to your observability stack.
- Favor open technologies to avoid vendor lock-in: Choosing open-source, vendor-agnostic data collectors and processors prevents you from becoming tied to specific platforms. It allows you to integrate new cloud services into your pipeline without risking compatibility issues.
- Implement automated anomaly detection: Automated anomaly detection systems alert you in real-time when unexpected changes occur in your data. They allow you to respond more rapidly to emerging problems. You can find AI-powered anomaly detection features within observability platforms such as the Elastic stack and Datadog.
- Make your observability pipeline observable too: It sounds meta, but observability pipelines should be observable themselves. Monitoring key pipeline metrics such as data throughput, query latency, and time spent applying transformations provides valuable insights that can help you make targeted improvements.
Following these tips will help your observability pipelines stay focused and effective.
Improving workflows with Spacelift
Spacelift allows you to connect to and orchestrate all of your infrastructure tooling, including infrastructure as code, version control systems, observability tools, control and governance solutions, and cloud providers.
Spacelift enables powerful CI/CD workflows for OpenTofu, Terraform, Pulumi, Kubernetes, and more. It also supports observability integrations with Prometheus and Datadog, letting you monitor the activity in your Spacelift stacks precisely.
With Spacelift, you get:
- Multi-IaC workflows
- Stack dependencies: You can create dependencies between stacks and pass outputs from one to another to build an environment promotion pipeline more easily.
- Unlimited policies and integrations: Spacelift allows you to implement any type of guardrails and integrate with any tool you want. You can control how many approvals you need for a run, which resources can be created, which parameters those resources can have, what happens when a pull request is open, and where to send your notifications data.
- High flexibility: You can customize what happens before and after runner phases, bring your own image, and even modify the default workflow commands.
- Self-service infrastructure via Blueprints: You can define infrastructure templates that are easily deployed. These templates can include policies/integrations/contexts/drift detection for reliable deployment.
- Drift detection & remediation: Ensure the reliability of your infrastructure by detecting and remediating drift.
To learn more about Spacelift, create a free account or book a demo with one of our engineers.
Key points
Observability pipelines extract, transform, and load (store) the data generated by your systems. They perform the prep work that turns raw data into useful, analyzable information.
Building a successful observability pipeline takes time, but your investment will be repaid in the form of improved efficiency and scalability. Automatically aggregating data from different sources ensures you’re always seeing the full picture, while the ability to apply a standard set of transformations improves analysis accuracy. Data’s ready to use when it exits the pipeline, eliminating the need for manual manipulation.
Solve your infrastructure challenges
Spacelift is a flexible orchestration solution for IaC development. It delivers enhanced collaboration, automation, and controls to simplify and accelerate the provisioning of cloud-based infrastructures.
