
DevOps metrics are quantitative measures of how efficiently and reliably your team builds, ships, and operates software. They cover the whole delivery pipeline, from a commit entering version control to a release running in production. Tracked over time, they show you where work stalls, how often changes break things, and whether the process changes you make actually improve anything.
In this blog post, we will explore the importance of monitoring DevOps metrics and what teams should be tracking. From the widely recognized metrics that became mainstream due to DORA (DevOps Research and Assessment) to other essential indicators, we’ll provide a comprehensive guide to help you measure and optimize your DevOps practices.
What are DevOps metrics?
DevOps metrics are key performance indicators (KPIs) that measure how efficiently and reliably you build, ship, and operate software. The best-known set comes from DORA (DevOps Research and Assessment), which now tracks five: change lead time, deployment frequency, failed deployment recovery time, change fail rate, and deployment rework rate. DORA groups the first three as throughput and the last two as instability. Teams use them to find delivery bottlenecks, cut recovery times, and see whether changes to their process actually work.
The importance of monitoring DevOps metrics
By measuring the right metrics, DevOps teams can gain actionable insights into their workflows, identify problematic areas, and improve their systems over time. Monitoring these metrics isn’t just about collecting data. It’s also about understanding the story behind the numbers and driving more intelligent decision-making.
This is where selecting and focusing on the right metrics becomes critical.
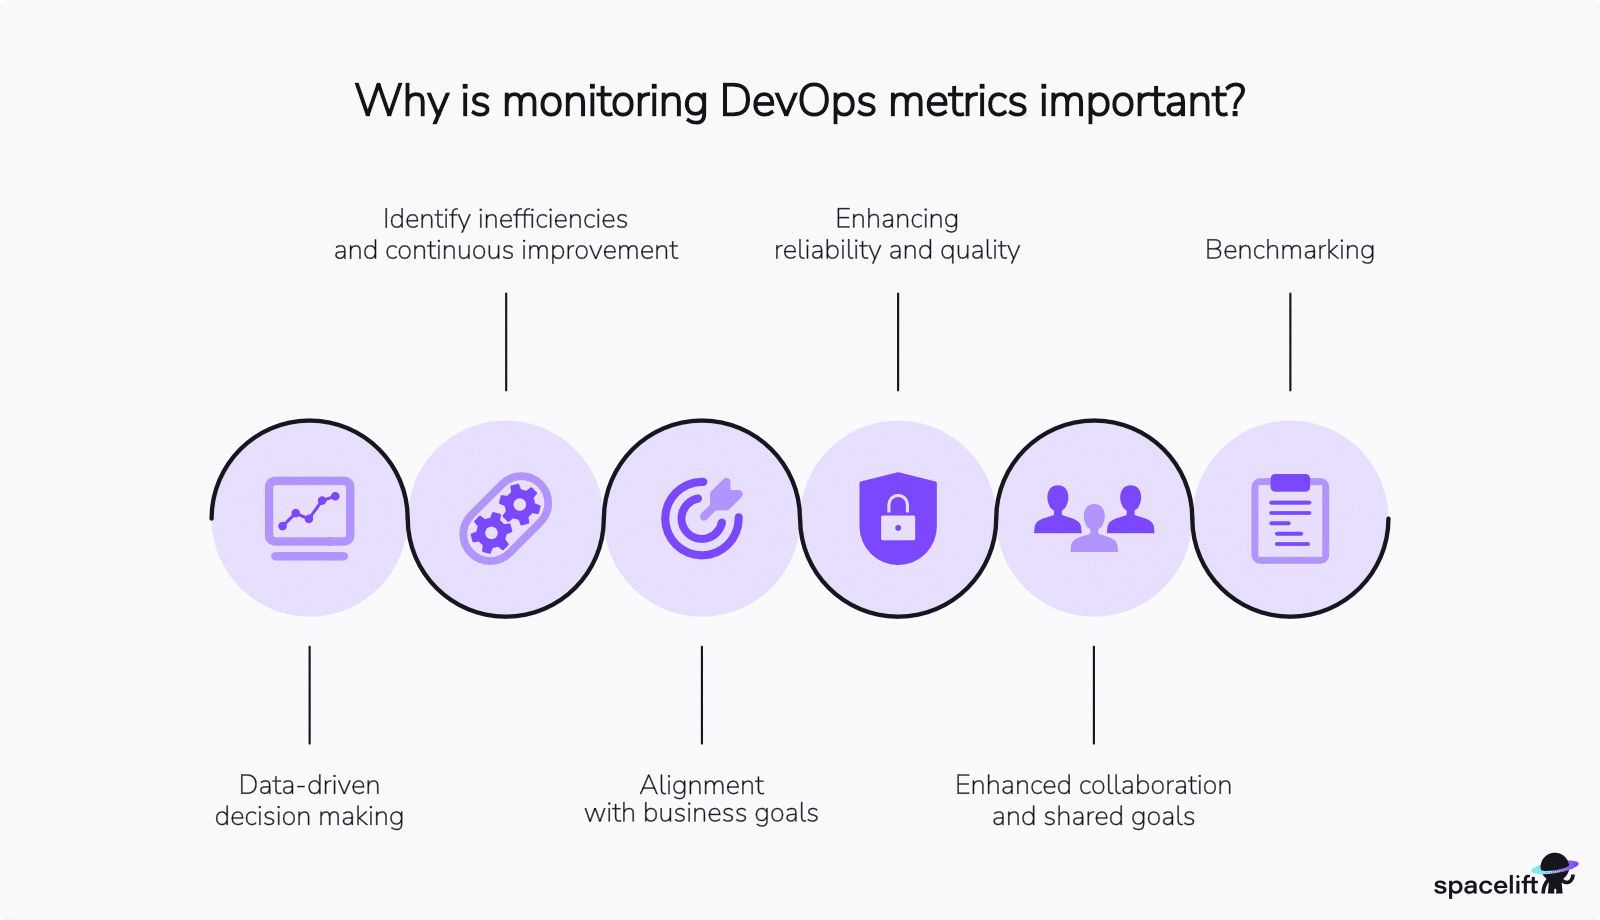
- Data-driven decision making — DevOps metrics provide objective, quantifiable insights into the performance and health of your systems. They can provide evidence to inform strategic decisions for process improvements, technology investments, and resource allocation.
- Identify inefficiencies and continuous improvement — Monitoring specific metrics around efficiency and frequency can help pinpoint workflow bottlenecks, enabling teams to streamline processes and improve productivity.
The DevOps movement is based on the principle of continuous improvement, and metrics are the foundation of this iterative process. By consistently monitoring and evaluating key metrics, teams can establish a feedback loop to experiment, measure results, and refine their processes over time.
- Alignment with business goals — DevOps metrics can often help align technical operations, strategy, and broader business objectives.
For example, setting high standards for metrics related to deployment frequency and change lead time can enable an organization to release software faster and respond quickly to market demands. - Enhancing reliability and quality — Many metrics discussed in this article detect potential issues early. By monitoring and alerting on these metrics, DevOps teams can spot problems before they escalate into incidents, effectively enhancing product performance and user satisfaction.
Other metrics, such as the mean time to recovery (MTTR), are critical for assessing a system’s overall reliability and stability.
- Enhanced collaboration and shared goals — One of the biggest challenges in large and distributed organizations is alignment across different departments and roles. By setting expectations, goals, and KPIs around these DevOps metrics, we can help teams align on shared targets. DevOps metrics serve as a common language for different teams, fostering better collaboration.
- Benchmarking — Setting and tracking specific and industry-standard DevOps metrics allows organizations to benchmark themselves against their competitors and the industry. This provides an excellent opportunity to measure performance in a quantifiable way and help set ambitious targets.
Key DevOps metrics to monitor
Not all metrics are created equal, and in DevOps, knowing which ones to monitor can make the difference between successful monitoring and alert fatigue. Effective DevOps metrics provide actionable insights that drive better decision-making and continuous improvement.
DORA Metrics
The DevOps Research and Assessment (DORA) team has identified four key metrics that are strong indicators of software delivery performance and organizational success. These metrics, known as DORA metrics, started as the “four keys.”
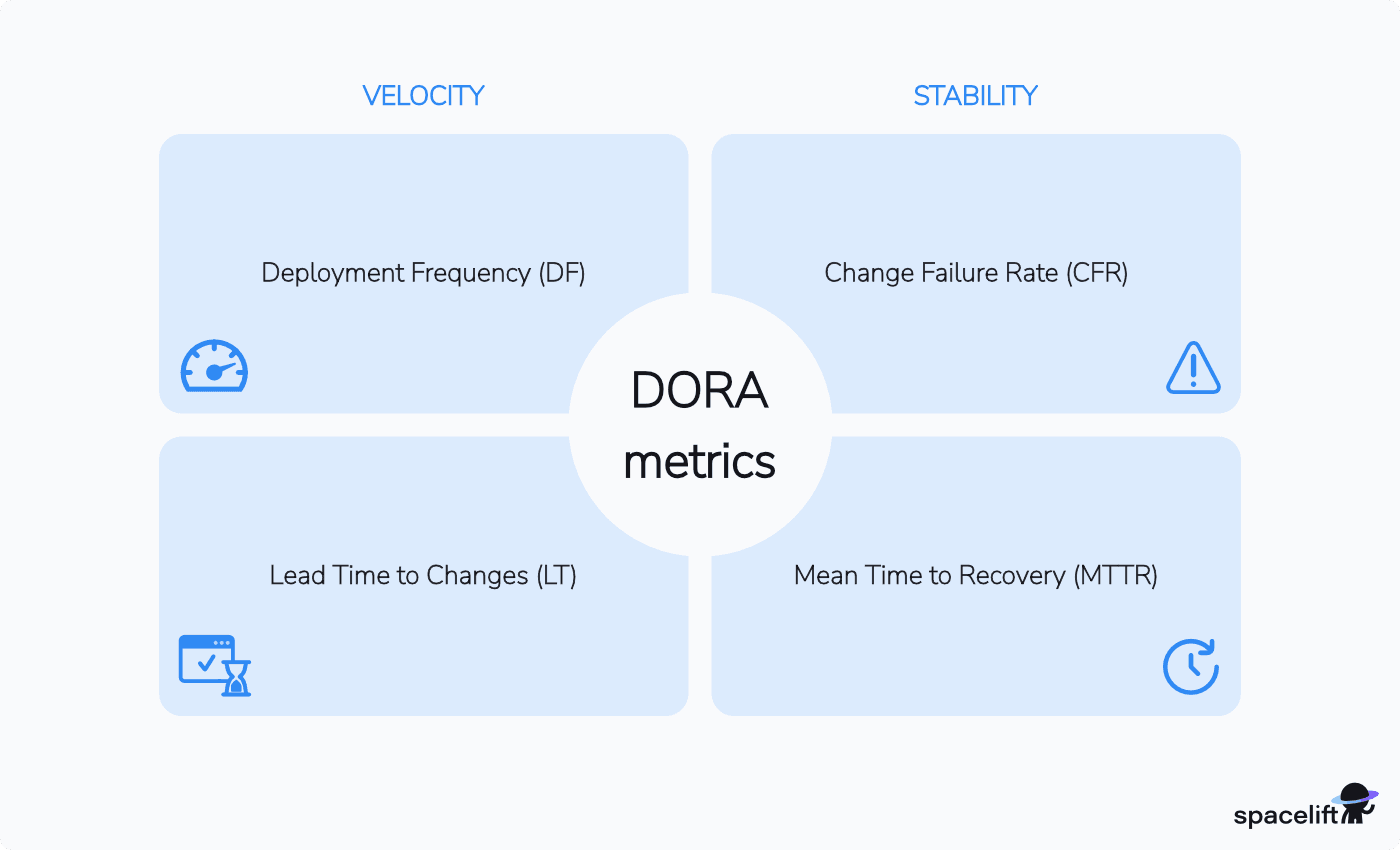
There are now five, and DORA groups them by throughput and instability rather than the older velocity-and-stability split:
Software delivery throughput
- Change lead time: the time it takes for a change to go from committed to version control to deployed in production.
- Deployment frequency: the number of deployments over a given period, or the time between deployments.
- Failed deployment recovery time: the time it takes to recover from a deployment that fails and needs immediate intervention.
Software delivery instability
- Change fail rate: the ratio of deployments that need immediate intervention, usually a rollback or a hotfix.
- Deployment rework rate: the ratio of deployments that are unplanned and happen because of a production incident.
Recovery time sitting under throughput surprises most people, because it feels like a stability measure. DORA groups metrics by how they behave together statistically, not by intuition, and recovery time loads with the throughput factor.
DORA’s own research finds top performers do well across all five and low performers do poorly across all five, so speed and stability are not the tradeoff they are usually assumed to be.
What are good DORA benchmarks?
These are DORA’s 2024 performance clusters, the last set it published:
| Level | Change lead time | Deployment frequency | Change fail rate | Failed deployment recovery time |
| Elite | Less than one day | On demand | 5% | Less than one hour |
| High | One day to one week | Daily to weekly | 20% | Less than one day |
| Medium | One week to one month | Weekly to monthly | 10% | Less than one day |
| Low | One to six months | Monthly to biannually | 40% | One week to one month |
Medium performers reported a lower change fail rate than high performers in 2024, inverting the usual pattern. Elite performers still deployed on demand with the lowest failure rate, and low performers still deployed least with the highest, but the middle two groups swapped. Fewer than 20% of respondents landed in the elite cluster.
Why DORA retired the elite, high, medium, and low tiers
Someone on your leadership team put “reach elite” in a quarterly goal. You pushed the deployment frequency number up, the tier didn’t move, and nobody could tell you what to change next. The bar was never fixed anyway. DORA recalculated it from each year’s survey data, so the elite you chased in 2023 was not the elite defined in 2021.
DORA has now dropped it. The 2025 report, retitled “State of AI-assisted Software Development,” retires the elite, high, medium, and low clusters and puts seven team profiles in their place. The new title is a scope change, not a rebrand.
The old clusters told you where you sat and stopped there. They never connected back to the capabilities you would have to change to move up. They were also less stable than the industry treated them.
In 2022, the analysis surfaced only three clusters, so DORA cut the elite tier entirely, then brought it back in 2023. Teams spent a decade benchmarking against a label that went missing for a year.
The seven profiles come from eight measures: throughput, stability, team performance, product performance, individual effectiveness, time spent on valuable work, friction, and burnout. “Foundational challenges” teams post low performance and high burnout alongside high system stability, because they ship so rarely that there is nothing to destabilize. “Harmonious high achievers” score well on delivery, product outcomes, and team well-being at once. “Legacy bottleneck” and “Pragmatic performers” fill in the middle.
One caveat. The profiles come out of the same annual cluster analysis that produced the tiers, so the labels can shift next year too.
If you need a tier to point at in a board deck, use the 2024 report. The 2025 report still publishes metric distributions, so you are not short of numbers either way. What is gone is the ranking. If you want to know what to fix, use the profiles.
Additional DevOps metrics and KPIs
Apart from the solid foundation you get from tracking and reporting on the DORA metrics, several other metrics offer valuable insights into various aspects of the software delivery lifecycle, the system’s health and reliability, and operational efficiency.
6. SLAs & SLOs
Service level agreements (SLAs) and service level objectives (SLOs) define the expected service reliability and performance level.
SLAs are usually contractual agreements defining the expected level of service. SLOs are specific, measurable targets that you set for service performance.
Meeting SLAs and SLOs keeps customer trust intact. Frequent violations may indicate underlying issues with system reliability or capacity planning.
7. Availability/Uptime
Availability and uptime metrics measure the percentage of time that a system or a service is operational and functional to end users. High availability correlates with reliable systems, and monitoring uptime helps teams identify and address issues that lead to downtime.
8. Application usage and traffic
Application usage and traffic metrics generally measure the number of users, requests, transactions, or other relevant volume-based metrics that a system or an application handles over time. These metrics provide insights into system scalability and capacity by measuring system load.
They are also used to optimize resource allocation and identify popular features. Typical metrics include daily/monthly active users (DAU/MAU), page views, and API calls.
9. Application performance
Application performance metrics measure how well an application functions from a user’s perspective.
Typical metrics include:
- Response time
- Error rates
- Latency
- Throughput
Monitoring performance metrics with tools such as Application Performance Monitoring (APM) ensures the app meets user expectations and helps avoid churn.
10. Test coverage
Test coverage metric measures the percentage of software code covered by automated tests. Higher test coverage reduces the risk of undetected bugs reaching production systems. Examples of tests include unit tests, integration tests, and end-to-end tests. Aim for high coverage, but your tests must be more meaningful, as maintaining them is also a cost.
11. Infrastructure as code (IaC) coverage
Infrastructure as code (IaC) coverage measures the percentage of infrastructure resources managed through code rather than manual configuration.
Higher IaC coverage correlates with improved consistency, repeatability, and effective disaster recovery capabilities, which is what DevOps best practices call for.
12. Defect escape rate
Defect escape rate measures the percentage of defects that make it to production systems versus those caught during testing. A high defect escape rate might indicate testing and quality assurance gaps.
13. Mean time to detection (MTTD)
The mean time to detection metric measures the average time it takes to identify an issue or incident after it occurs. The faster we can detect and identify problems, the faster we can resolve them. MTTD reflects the effectiveness of an organization’s observability and alerting strategy.
14. Mean time between failures (MTBF)
Mean time between failures (MTBF) measures the average time between failures of a system you repair and put back into service. Longer MTBF points to a more reliable system. You will sometimes see mean time to failure (MTTF) used the same way, but MTTF properly applies to components you replace rather than repair, so MTBF is the right term for a running service.
15. Continuous Integration (CI) metrics (runs, average time, failure rate)
These metrics around CI measure performance and efficiency. They typically include the number of CI runs, the average time per run, and the failure rate of builds. Efficient CI pipelines reduce developer friction and idle time and enable faster feedback loops. High failure rates or long build times indicate areas for improvement.
16. Vulnerability open rate (VOR)
The vulnerability open rate tracks the rate at which new security vulnerabilities are discovered in your systems. This metric is usually measured when new code is released into production. Tracking VOR helps teams prioritize security and minimize risk by addressing vulnerabilities before they are exploited.
17. Unit cost
Unit cost tracks the cost of delivering a unit of service or functionality relevant to your business. Measuring total or aggregate costs is often not a good measurement of cost-effectiveness.
Measuring and reporting unit costs provides a more accurate representation of how efficient you are with your resources as it directly relates to a relevant business metric. Examples include cost per transaction, cost per user, cost per widget, and cost per feature.
How to implement effective monitoring practices
The real value of an effective observability strategy is how you monitor and act on the measured metrics, driving continuous improvements and operational excellence.
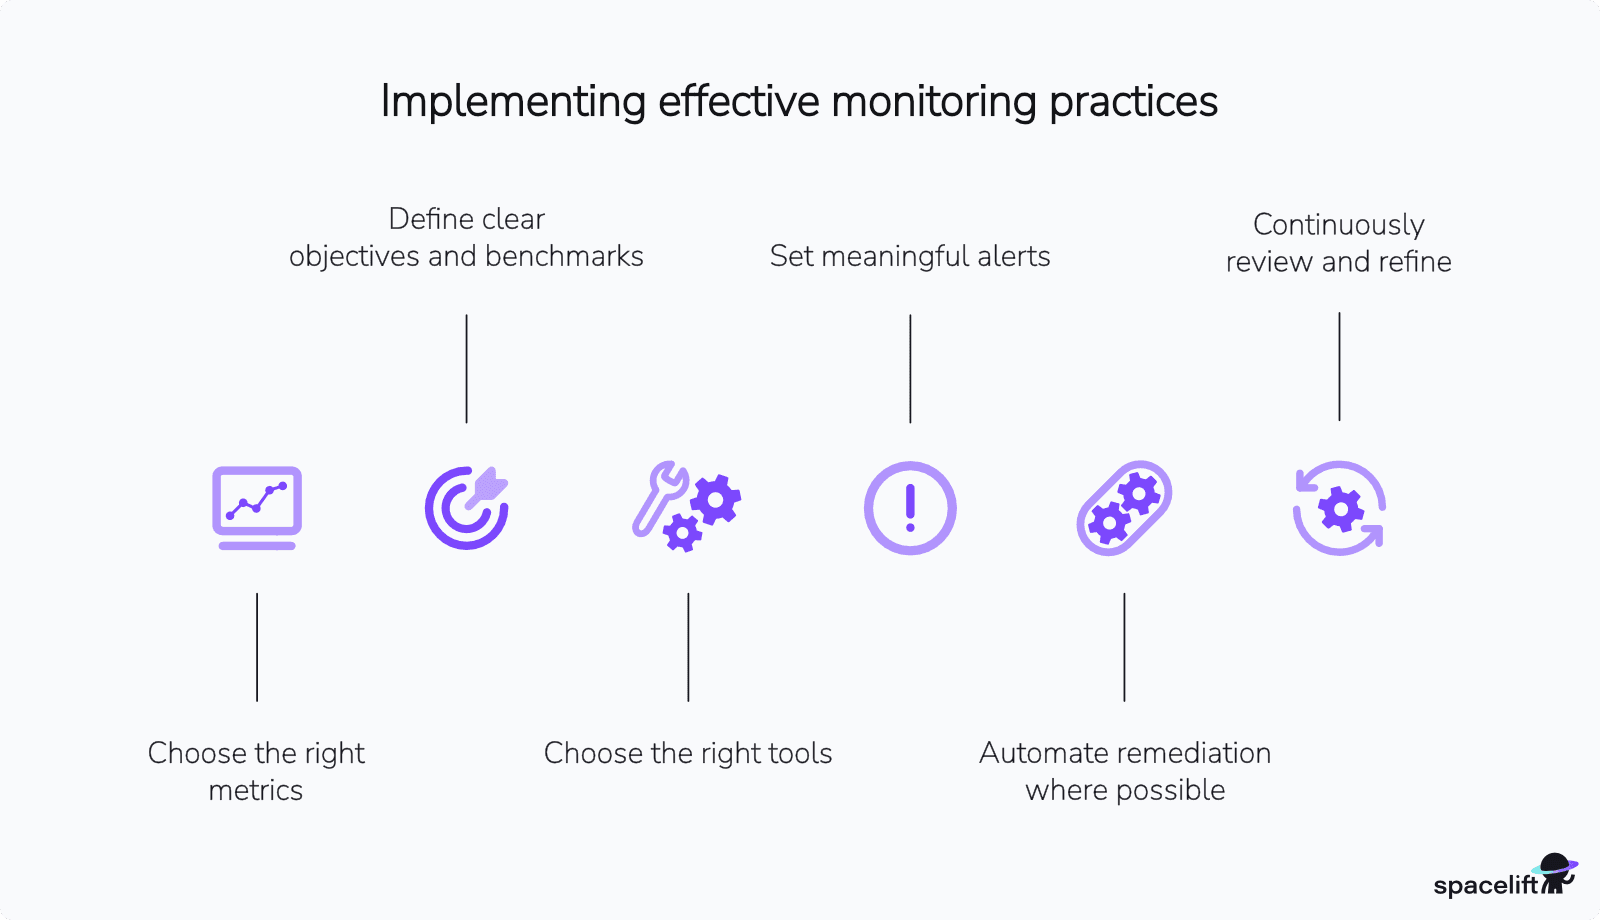
- Choose the right metrics — Not all metrics will be equally relevant to every team or organization. The key is identifying which metrics align with your goals, whether they focus on speed, quality, reliability, or cost efficiency.
- Define clear objectives and benchmarks — Define the reasoning behind measuring these metrics and tie it back to a business or operational goal. Clearly defined objectives ensure your monitoring efforts are purposeful and impactful. Monitoring is most effective when you can measure progress against a baseline. Use historical data to establish benchmarks for your metrics.
- Choose the right tools — Select monitoring tools that align with your organization’s needs and scale. Before you select any tools, list all your needs and requirements and perform trial periods with various tools to test them out.
Ensure these tools integrate with your existing workflows and provide real-time actionable insights while fitting your budget. Use these tools to automate your metrics’ collection, aggregation, and analysis. - Set meaningful alerts — Leverage tools with built-in alerting and anomaly detection to ensure your team is notified of issues as they arise. Too many alerts can overwhelm teams, leading to alert fatigue. Configure meaningful alerts that focus on critical thresholds and prioritize alerts that require immediate action.
- Automate remediation where possible — In some instances, automatic remediation of alerts and issues might be possible. Invest time to automatically fix issues whenever feasible with functionalities such as autoscaling, rolling back deployments, or self-healing automation. This reduces the need for human intervention, freeing teams to focus on more complex problems.
- Continuously review and refine — Monitoring isn’t a set-it-and-forget-it process. Regularly review your observability strategy to ensure it aligns with evolving goals and challenges. Drop metrics that no longer add value and introduce new ones as needed to address emerging priorities. Conduct post-incident reviews to understand what happened and how to prevent similar issues.
What tools to use for tracking DORA metrics?
Tools for tracking DORA metrics offer diverse features, such as integration capabilities, ease of use, and specific focus areas within the software development lifecycle.
Below is a summary of some of the top tools:
| Tool type | Tool name | Metrics covered |
| Analytics and reporting | Splunk, Grafana, Looker Studio, Looker | Four keys, depending on what you feed them |
| CI/CD platforms | Jenkins, GitLab CI/CD, GitHub Actions, CircleCI | Deployment frequency, change lead time |
| Monitoring and incident management | Datadog, New Relic, PagerDuty, Prometheus | Failed deployment recovery time, change fail rate |
| Specialized DORA tools | LinearB, Waydev, Code Climate Velocity | Four keys |
| Value stream management | Planview Viz, Planview Plutora, ServiceNow | Four keys |
How can Spacelift help your DevOps strategy?
A successful DevOps implementation requires capable tools that automate your processes, including CI/CD, IaC, and infrastructure management. These practices can be tricky to get right, but dedicated platforms make it easy to manage your infrastructure resources — saving valuable time that you can return to your business.
Spacelift is an infrastructure orchestration platform that helps you automate and govern cloud deployments with the tools you already use. You can manage infrastructure as code (IaC) and configuration workflows across OpenTofu, Terraform, CloudFormation, Kubernetes, Pulumi, Ansible, and Terragrunt, without forcing teams into a single tool or workflow.
Spacelift gives you a single place to deploy, manage, and control cloud resources across providers. It’s cloud-agnostic, so you can connect to the cloud of your choice from the platform. It’s also API-first, anything you can do in the web interface, you can do via the API, the command-line interface (CLI), or the OpenTofu/Terraform provider.
The platform improves collaboration for DevOps teams, streamlines workflow management, and enforces governance across infrastructure deployments. It also provides visibility into what’s running, where it’s running, and how it got there, plus drift detection and remediation to keep live resources aligned with your IaC.
You can connect your version control system (VCS), GitHub, GitLab, Bitbucket, or Azure DevOps, and orchestrate multi-IaC workflows by defining stack dependencies and sharing outputs across configurations.
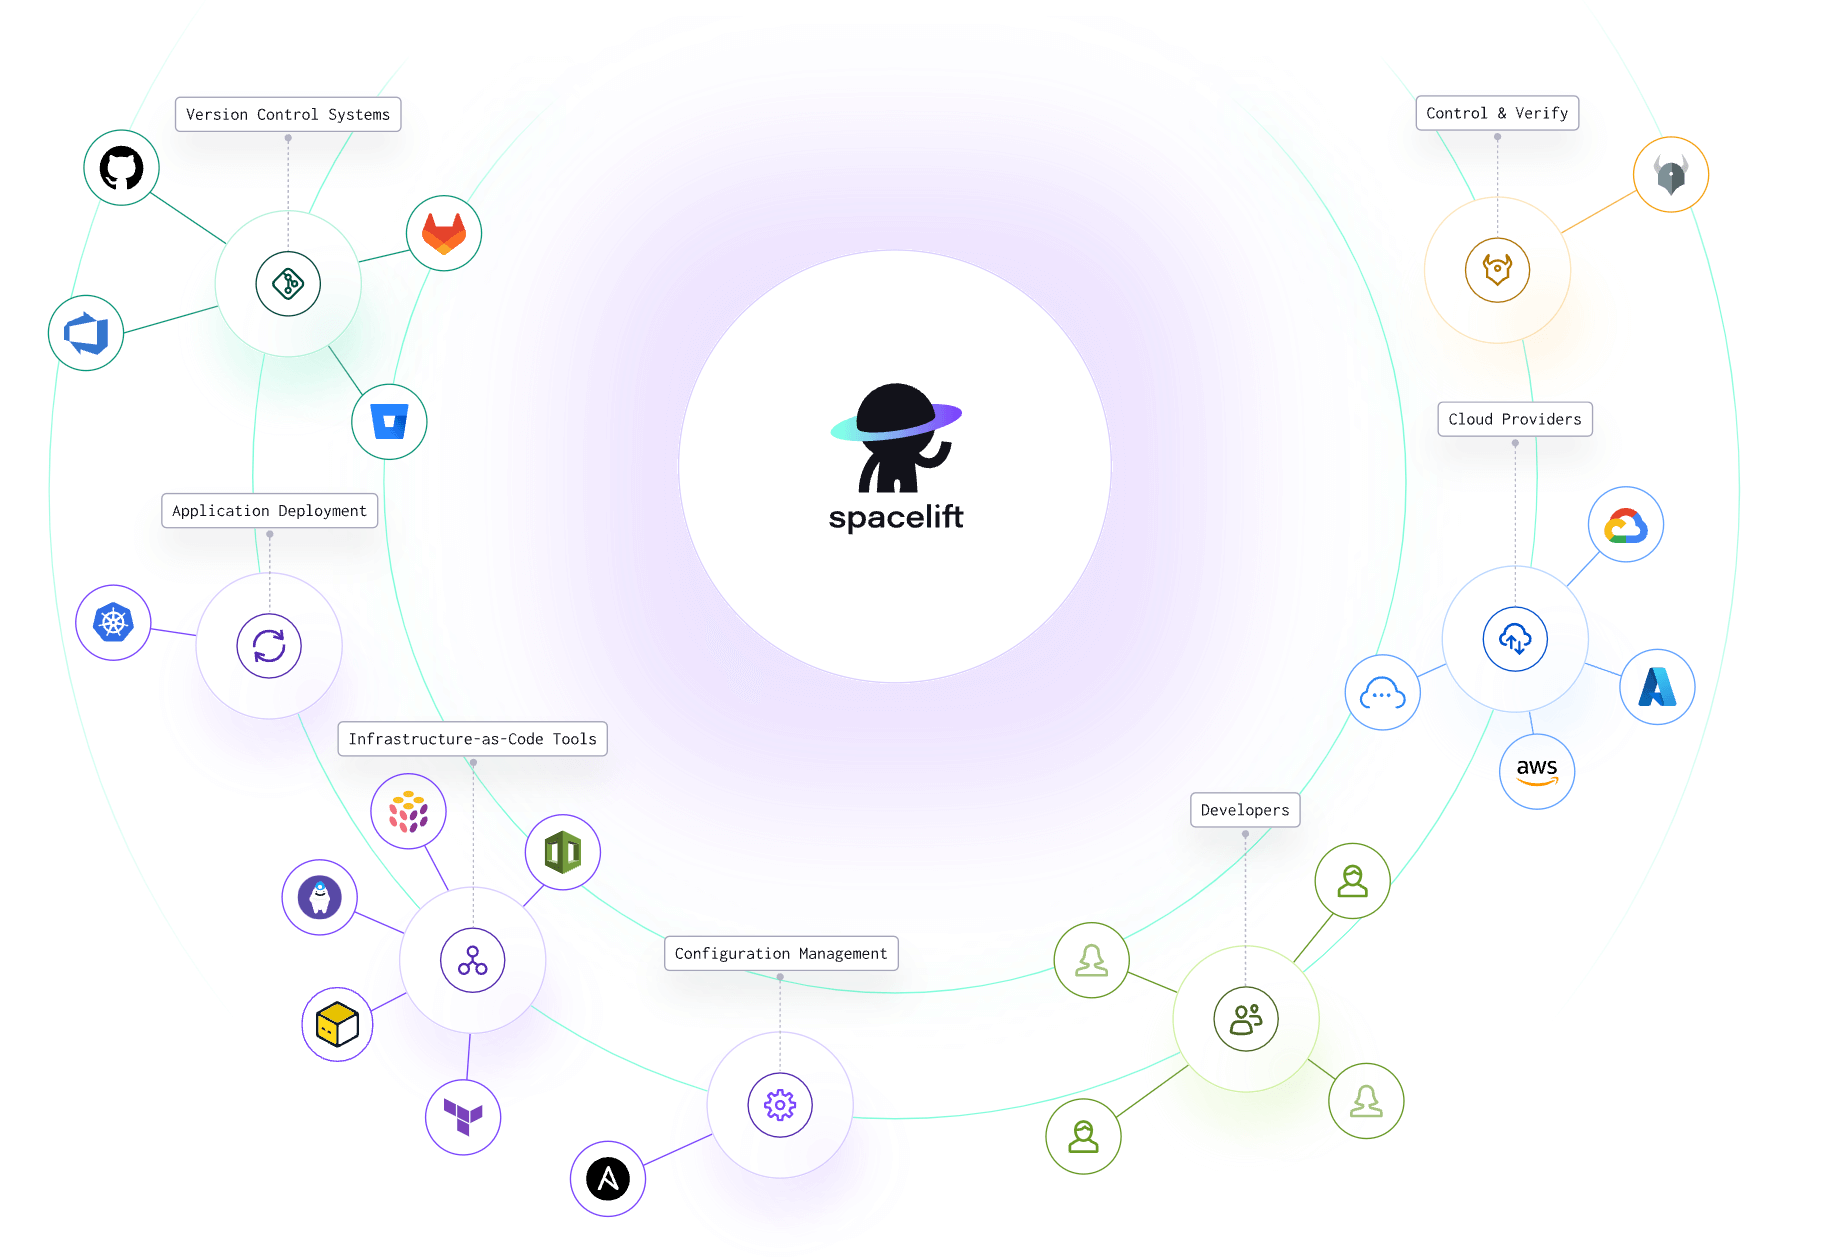
With Spacelift, you get:
- Multi-IaC orchestration: Spacelift can orchestrate workflows for Terraform, OpenTofu, Terragrunt, Pulumi, CloudFormation, Ansible, and Kubernetes on a single control plane. You can modernize tool by tool and stack by stack, alongside your existing setup, without changing your review and audit process. Dual support for Terraform and OpenTofu keeps your options open.
- Policy as code across the lifecycle: OPA-based policies govern who can trigger runs, what plans may contain, what requires approval, and what happens after a run finishes. These guardrails, built into the platform, are crucial to make automation and AI safe to adopt.
- Spaces, contexts, and private workers: Spaces give each team its own area with inherited access rules; contexts share configuration and credentials across stacks without duplication; and private workers keep runs within your own network when compliance requires it.
- Drift detection with remediation: Scheduled drift detection compares live infrastructure with its declared state per stack, and optional remediation runs can restore it.
- Stacks, dependencies, and GitOps: Stacks map repositories to infrastructure with plan-on-PR and apply-on-merge workflows. Stack dependencies provide multi-layer deployment order, replacing custom and unstable scripting that usually connects environments.
- Self-service, Blueprints, and Templates: platform teams publish parameterized Blueprints for freely editable stacks and version-pinned Templates for governed ones, and developers provision approved self-service infrastructure from a form.
- Spacelift Intelligence: AI capabilities are embedded in the platform, such as Infra Assistant and Intent, which operate within the same policies and approval flows as everything else, so that teams can adopt AI-driven workflows with the guardrails already in place.

Global payments platform Checkout.com committed itself to the goal of “IaC for everything,” and Spacelift delivered, offering a platform that teams could start using independently with minimal configuration — all within the constraints of the regulated environment Checkout.com operates in.
Key points
DevOps metrics are essential for understanding and optimizing your organizational processes around software development and delivery. By monitoring the right metrics, teams can identify inefficiencies, enhance system reliability, and build a habit of continuous improvement. In this blog post, we analyzed all the various actionable metrics you should be monitoring and discussed how to implement effective monitoring and observability practices.
The real power of metrics lies not just in tracking them but also in using them to drive actionable insights and improvements. Whether you’re new to DevOps or looking to refine your existing processes, identifying and monitoring key DevOps metrics is necessary to build resilient, efficient, and high-performing systems.
Solve your infrastructure challenges
Spacelift is an infrastructure orchestration platform built for IaC. It brings collaboration, automation, and governance into a single workflow, so your team can provision cloud infrastructure faster without losing control.