
Cost is one of the biggest barriers to Kubernetes adoption. The dynamic nature of Kubernetes resource utilization makes it easy to overspend, which acts as a deterrent against large-scale cluster deployments.
Kubernetes costs are driven by several factors such as redundant Nodes, incorrect Pod CPU, memory, and storage constraints, and failure to clean up unused objects. Features such as auto-scaling, where new compute resources are automatically provisioned, make your cluster highly flexible but also contribute to costs that can’t be accurately anticipated.
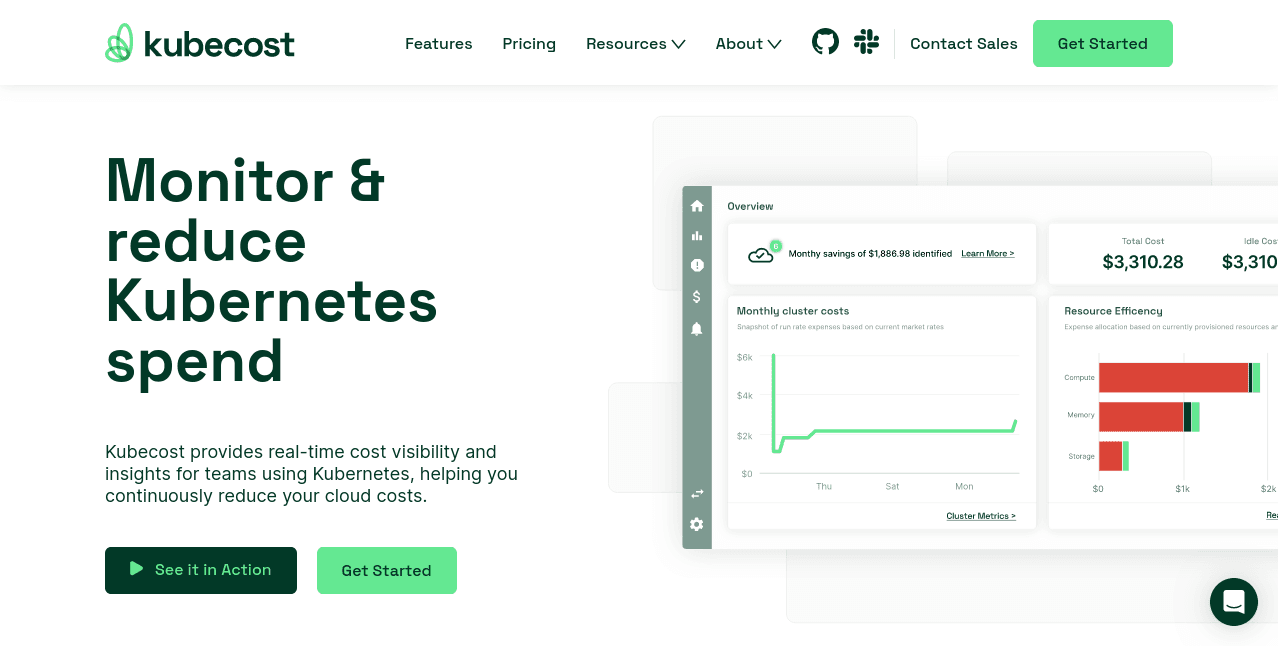
Kubecost is a tool that’s designed to address Kubernetes cost management challenges. It offers real-time visibility into your cluster’s costs, allowing you to understand where money is being spent. Here’s how to install Kubecost and use it to make savings in your own cluster.
We will cover:
What is Kubecost?
Kubecost is a dedicated solution for monitoring and reducing Kubernetes spend. Once installed in your cluster, Kubecost tracks your current costs and surfaces opportunities to reduce them.
Kubecost is an open-core tool. The fundamental cost allocation capabilities were open-sourced in 2022 as OpenCost, a CNCF Sandbox project.
Kubecost’s free community version gives you access to all its main features with a 15-day metric retention period. The paid Enterprise plan increases the retention period to unlimited and adds budgeting and SSO/SAML support. It also provides a unified multi-cluster cost monitoring view.
Kubecost features
The tool includes the following features:
- Monitor and reduce Kubernetes costs – Kubecost focuses on a two-stage approach to cost management: understanding what’s contributing to your spend, then making changes to reduce it.
- Real-time visibility into costs – Kubecost tracks costs in real-time. It displays the costs associated with your cluster’s current state, including all the resources you’re using. Kubecost can also integrate with external cloud services to report your total infrastructure spend. (Check out best practices for cloud cost optimization.)
- Precise cost breakdowns – You can see the costs associated with specific objects in your cluster, such as individual namespaces, services, and deployments. This lets you identify the areas which are contributing to overspend situations.
- Analyze resource utilization efficiency – Kubecost offers recommendations for how to improve your cluster’s efficiency without compromising performance or functionality.
- Receive alerts when cost thresholds are breached – A built-in alerting system notifies you when costs spike or configured thresholds are crossed.
Collectively, Kubecost’s capabilities empower you to detect Kubernetes cost overruns early before they significantly impact your monthly bill. Let’s dive in!
Kubecost vs OpenCost
You can deploy OpenCost instead of Kubecost if you want a wholly open solution that’s vendor-agnostic, based on a community-driven specification, and focused on cloud-native cost management essentials.
Kubecost builds upon OpenCost by adding features that include support for notifications and suggestions on how to reduce costs. It can also be used to aggregate costs from multiple clusters into one view. Whereas OpenCost is relatively low-level, Kubecost offers extra user-facing functionality to deliver a cohesive cost management experience.
How to use Kubecost
You can easily install Kubecost’s free edition using Helm, without having to sign-up first. You’ll need the Kubectl and Helm binaries installed and configured to connect to your cluster.
If you plan to register for a Kubecost Enterprise plan, follow the steps on the Kubecost website to create your account and deploy the Helm chart.
Step 1: Install Kubecost
Run the following Helm command to install Kubecost in your cluster:
$ helm upgrade --install kubecost \
	--repo https://kubecost.github.io/cost-analyzer/ cost-analyzer \
	--namespace kubecost \
	--create-namespace
Wait until the Kubecost Pods are shown as Running – this could take a few minutes while all the components start:
$ kubectl get pods -n kubecost
NAME                                          READY   STATUS    RESTARTS   AGE
kubecost-cost-analyzer-64fdfb58b5-tfwxw       2/2     Running   0          2m40s
kubecost-grafana-867bbf59c7-dfwj6             2/2     Running   0          2m40s
kubecost-kube-state-metrics-d6d9b7594-lqxq8   1/1     Running   0          2m40s
kubecost-prometheus-node-exporter-mtbqm       1/1     Running   0          2m40s
kubecost-prometheus-server-77bd8b8d6f-fqb6h   2/2     Running   0          2m40s
Next, run the following command to start a Kubectl port-forwarding session to the Pod that serves the Kubecost UI:
$ kubectl port-forward --namespace kubecost deployment/kubecost-cost-analyzer 9090This redirects your localhost:9090 address to the Kubecost UI. Visit http://localhost:9090 in your browser to access the interface. It’s worth waiting up to 15 minutes first, as Kubecost requires this time to collect its initial cost data from your cluster.
Step 2: Browse the Kubecost dashboard
After launching the UI, you’ll land on the Overview screen, which gives an at-a-glance view of your cluster’s costs over the past seven days. This may not be accurate until Kubecost has been active in your cluster for a few days.
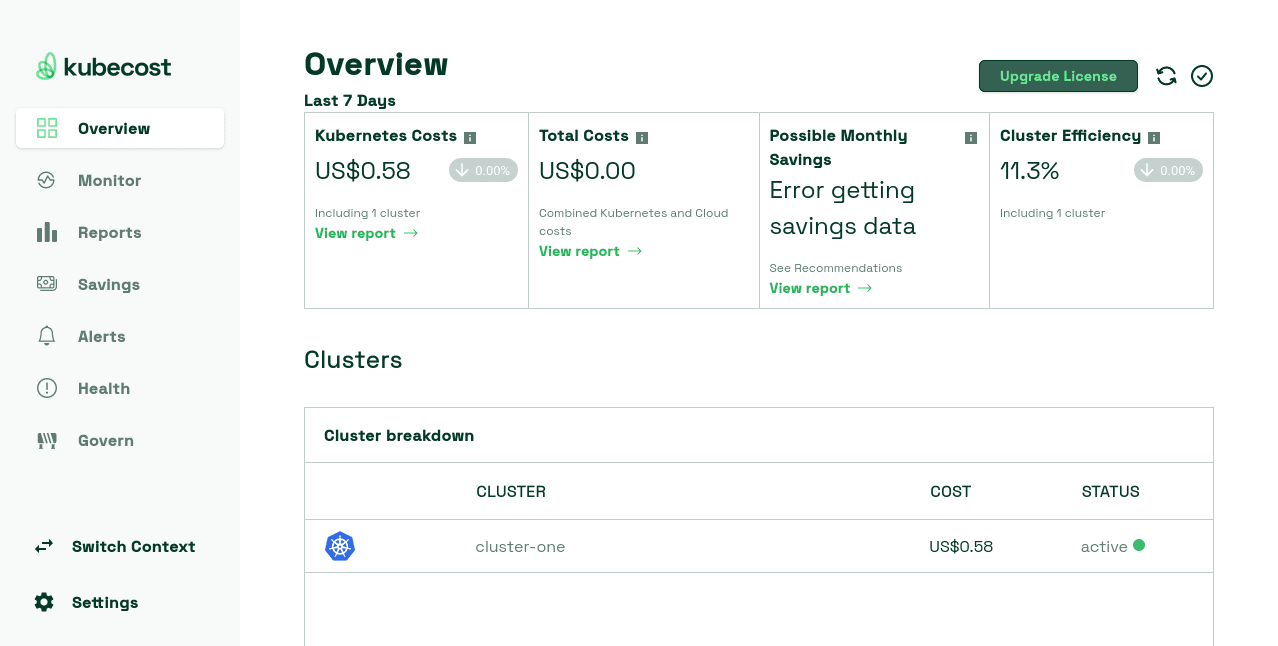
The Overview offers a summary of your possible monthly cost savings, as well as an estimate of your cluster’s efficiency. This is defined as the percentage of cost-weighted resources actively used over the last seven days.
A low efficiency score suggests the objects in your cluster aren’t fully utilizing the available resources, so you’re spending more than you need to.
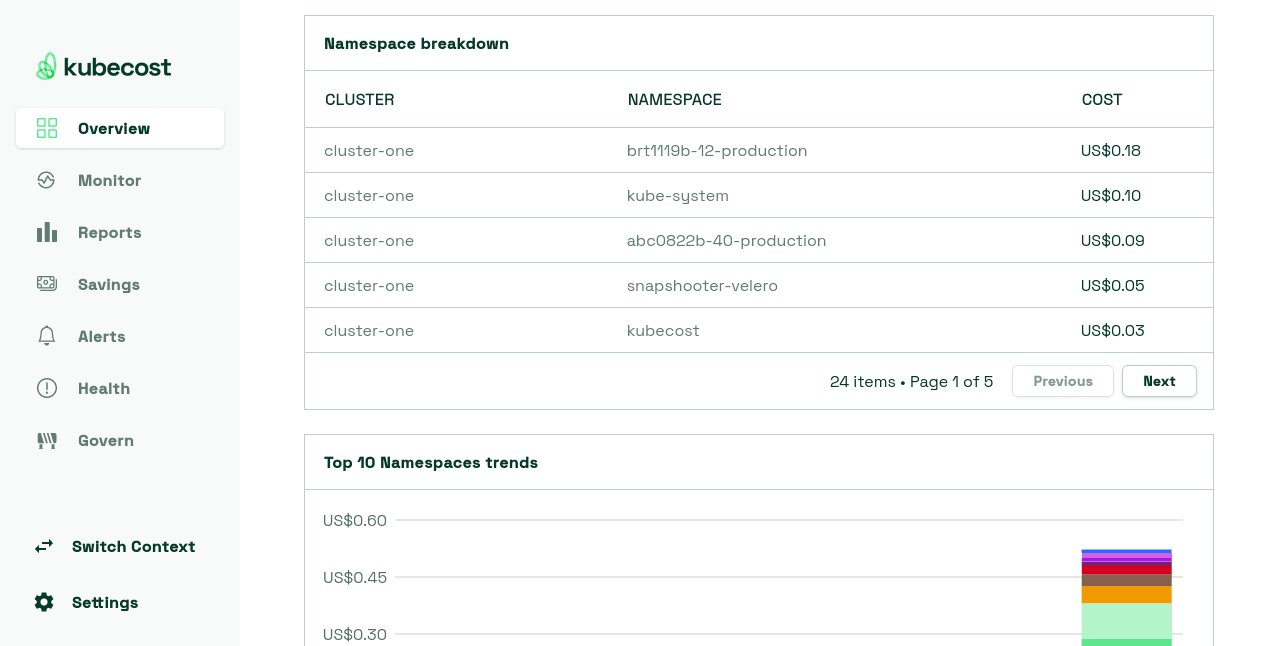
Further down the page, there are graphs visualizing trends in cost and efficiency over time. A per-namespace breakdown is provided too, letting you see where costs are being attributed.
Step 3: Check cost allocations
Cost allocation monitoring is one of Kubecost’s most powerful features. This is where you access a detailed view of how your cluster’s total cost is being accrued. It’s where you’ll usually spend most of your time in Kubecost.
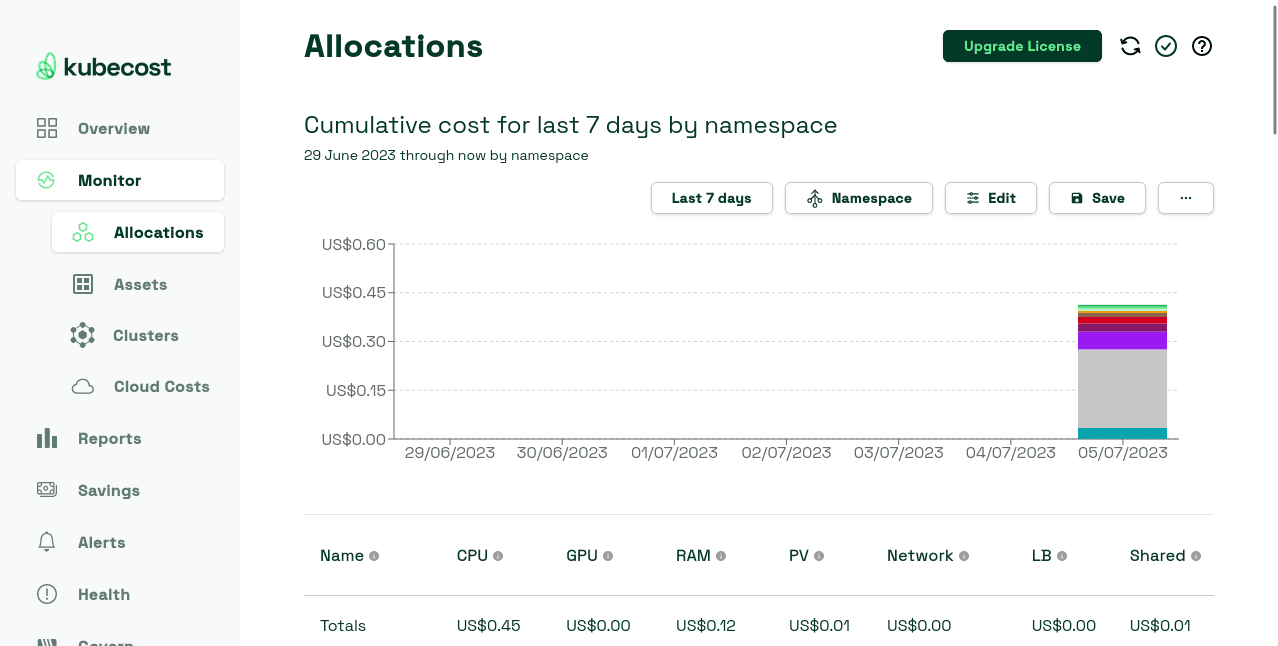
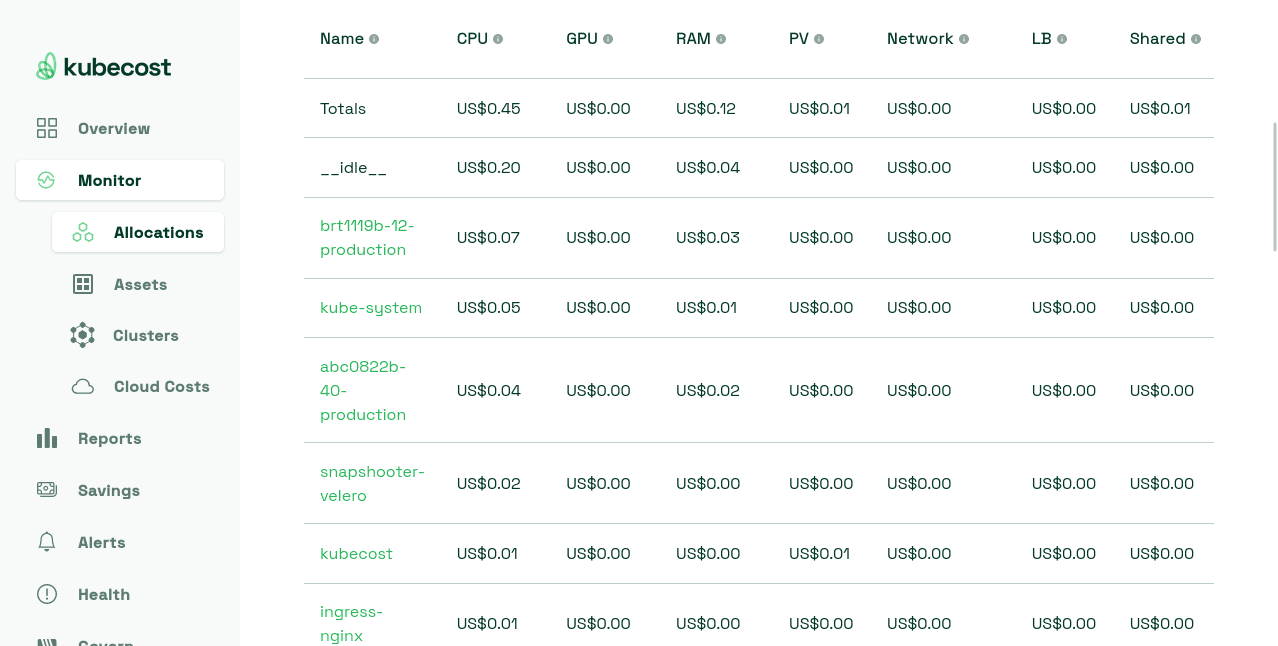
To access the information, head to Monitor > Allocations in the Kubecost sidebar. This defaults to displaying a stacked chart that shows how your cluster’s namespaces have contributed to your costs over the past seven days.
Below the chart, a table enumerates the CPU, GPU, RAM, PV (storage), network, load balancer, and shared costs for each of the namespaces displayed.
To change the report’s timeframe, click the “Last 7 days” button in the toolbar.
You can also change the report’s aggregation to view the costs associated with a different resource type, such as by-Deployment or by-Node:
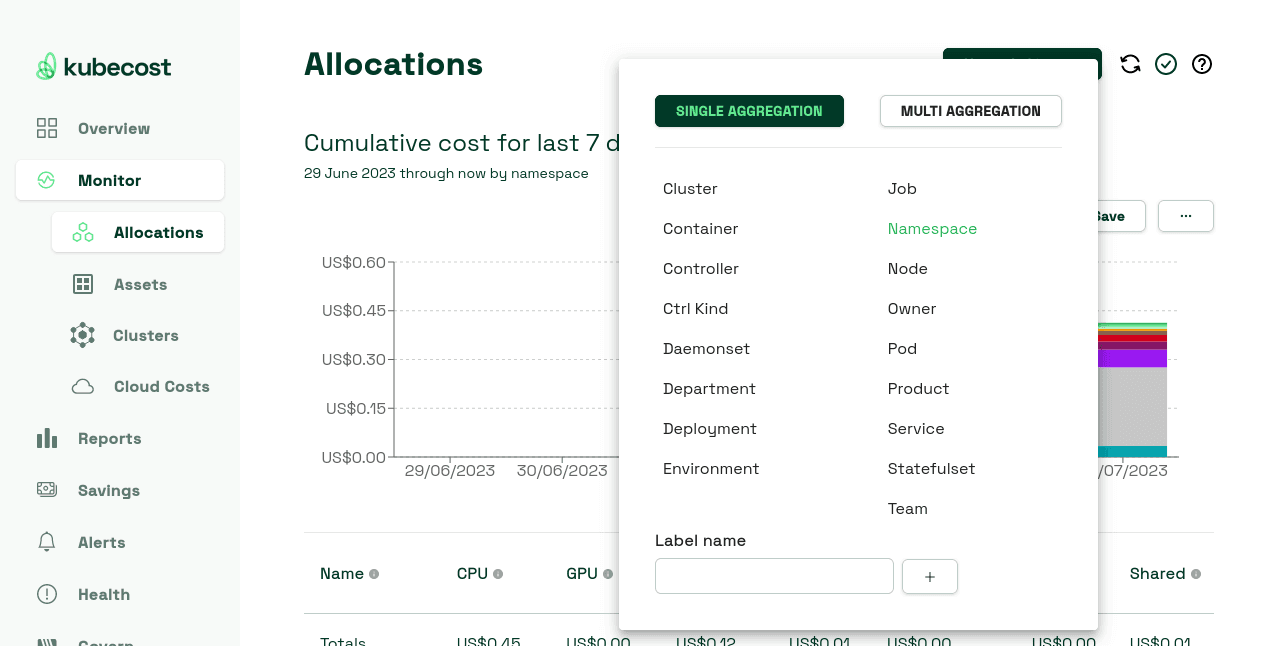
The settings allow you to aggregate by arbitrary labels too, such as your own label for identifying the team, service, or environment that a resource belongs to.
Kubecost also has predefined options for Team, Owner, Product, and Environment, which map to the team, owner, product, and environment Kubernetes labels respectively – you can change these names on Kubecost’s Settings screen.
Step 4: Kubecost custom reports
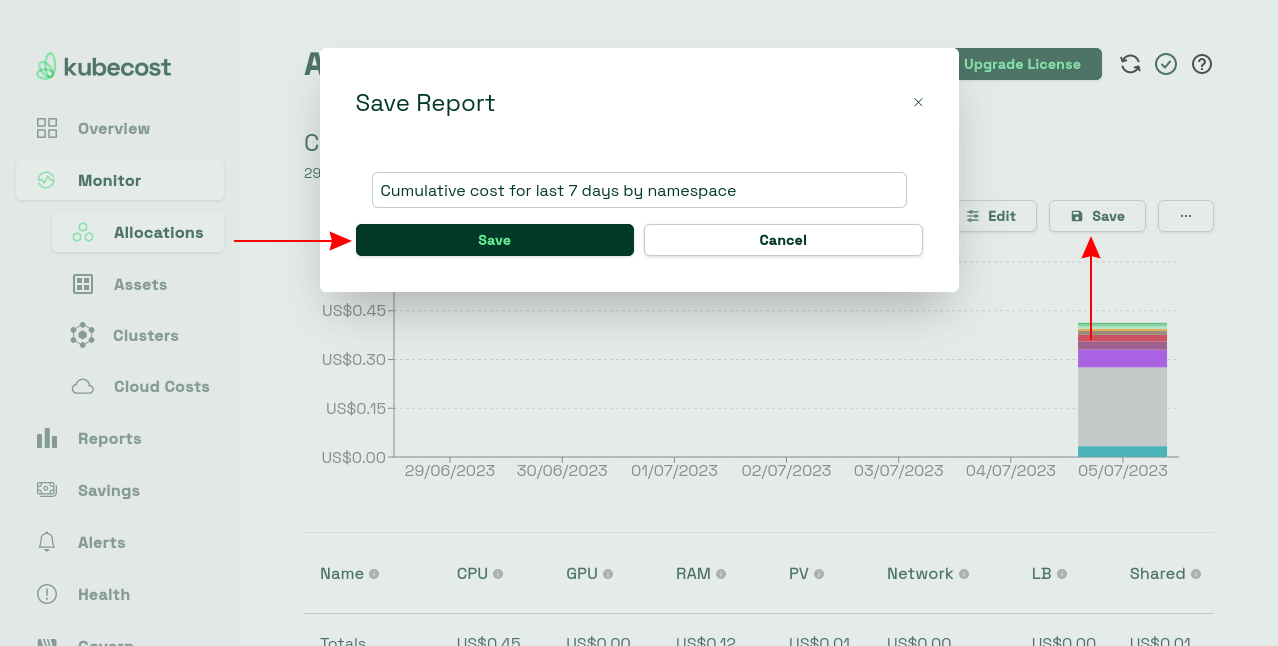
After you’ve customized the Allocations view, you can save your report for quick access in the future.
Click the “Save” button in the toolbar, give your report a name, and press the “Save” confirmation button in the dialog.
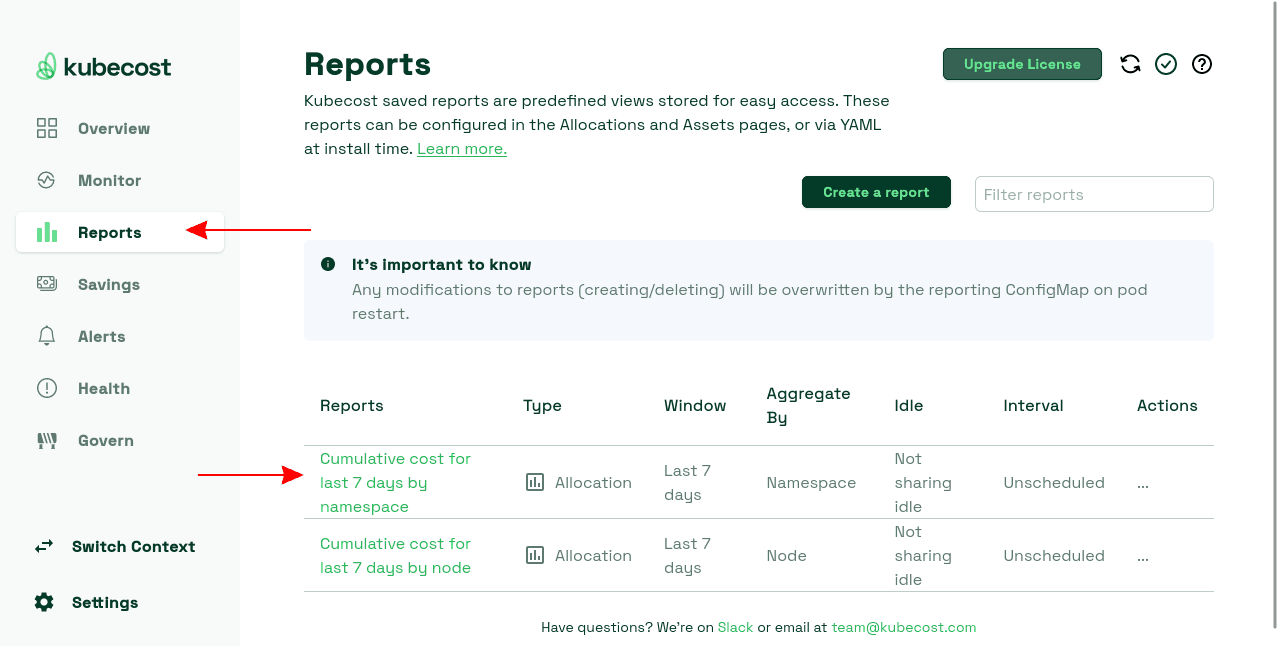
To revisit your report, first, select the “Reports” link from the left sidebar. Your saved reports will display in a table on the screen.
Click your report to open it with your saved settings.
Step 5: Look for savings
After gaining visibility into costs, you can start looking for ways to reduce them. Kubecost can help with this on its Savings screen, accessed via the left sidebar.
At the top of the screen, you’ll see your estimated monthly savings if you apply the recommendations shown on the cards below.
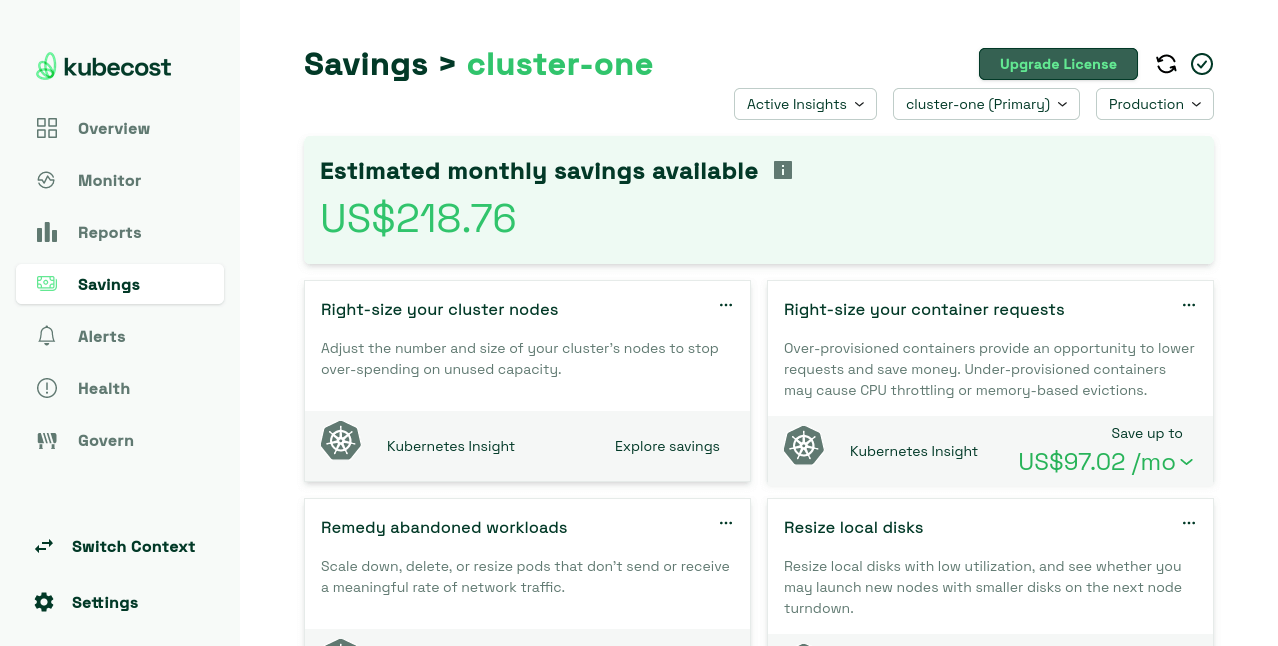
Click each suggestion to view a breakdown of how it was calculated. In the case of this cluster, Kubecost is suggesting that over-provisioned containers with excessive CPU and memory requests are wasting $97 per month.
Clicking the tile displays a table showing the discrepancies between each container’s actual resource requests and the recommended values calculated by Kubecost:
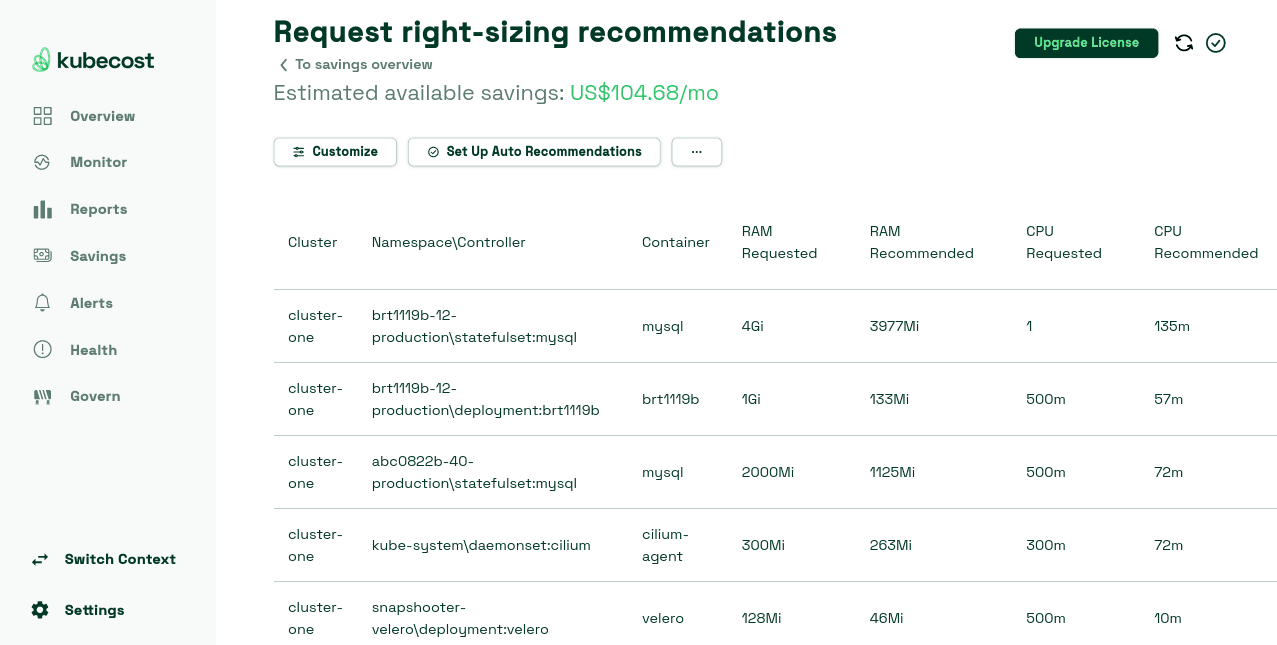
Right-sizing resource requests so they match actual utilization means fewer Nodes are required to support the workload. This translates into lower costs. Similarly, removing unused or abandoned resources frees up Node capacity for actively used objects, improving cluster efficiency.
Step 6: Cluster health score
Kubecost produces an overall health score for your cluster, based on all the information it collects.
You can view this score on the Health page, accessed from the left sidebar.
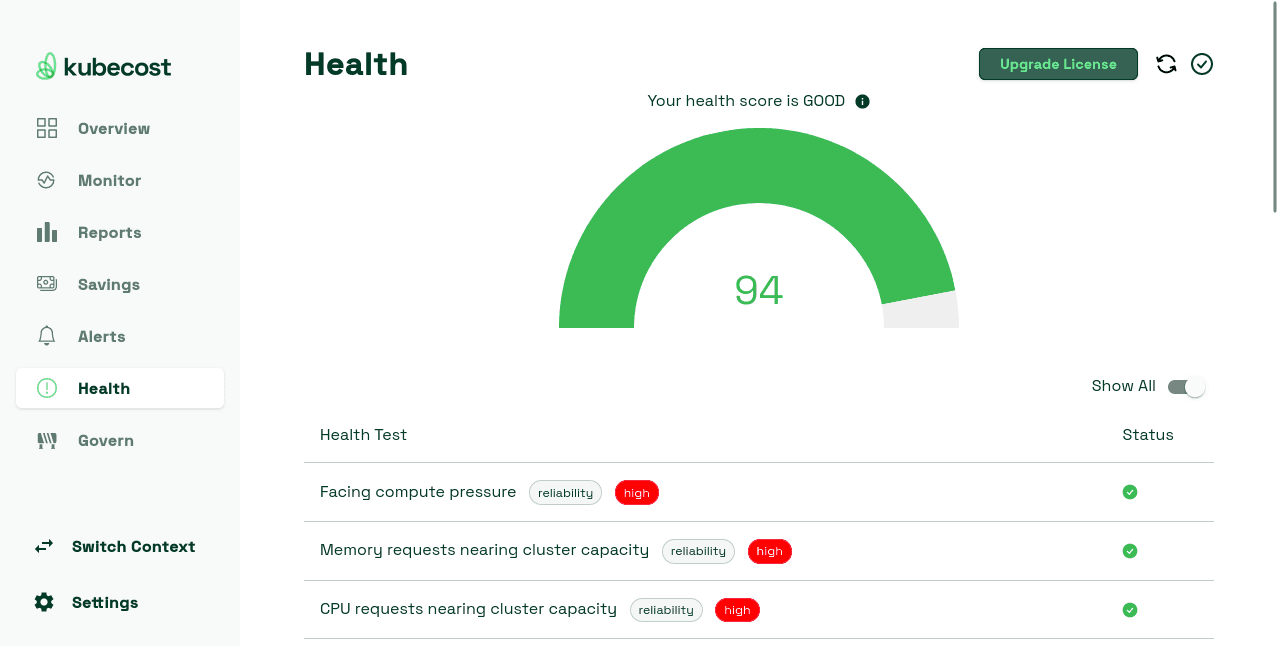
Your cluster’s score will be shown at the top of the screen. A high score generally indicates a healthy configuration with good resource utilization. However, there may still be issues to improve upon and some possible cost savings.
Lower scores are given to clusters with immediate problems, such as failing Pods, excessive CPU pressure, and insufficient storage.
The health tests performed are shown in a list below your score. Passed tests get a green tick, while failed ones are marked with a red cross.
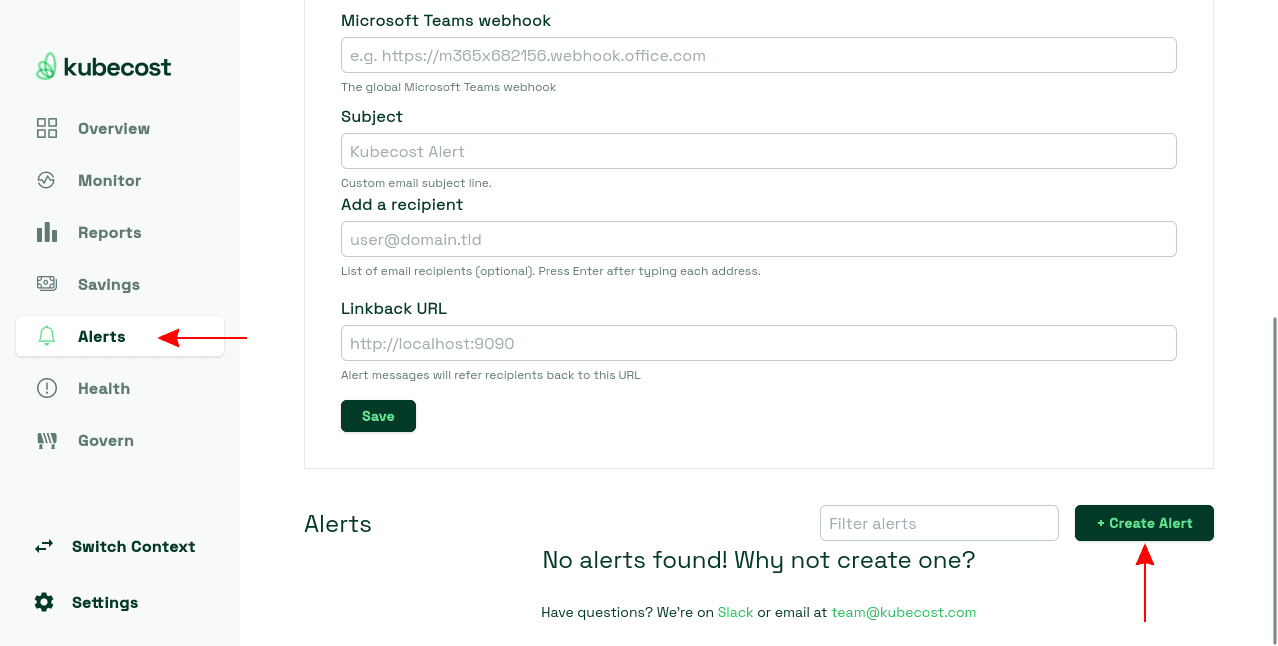
Step 7: Set Up Notifications
Kubecost can send you alerts via email, Slack, or Microsoft Teams when cost allocation, efficiency, or cluster health changes occur.
To set up an alert, click the Alerts link in the left sidebar. At the top of the screen, you’ll find the options for configuring an alert based on cluster or Kubecost health.
Cost threshold alerts are defined further down the page – scroll down to the “Alerts” heading, then press the “Create Alert” button.
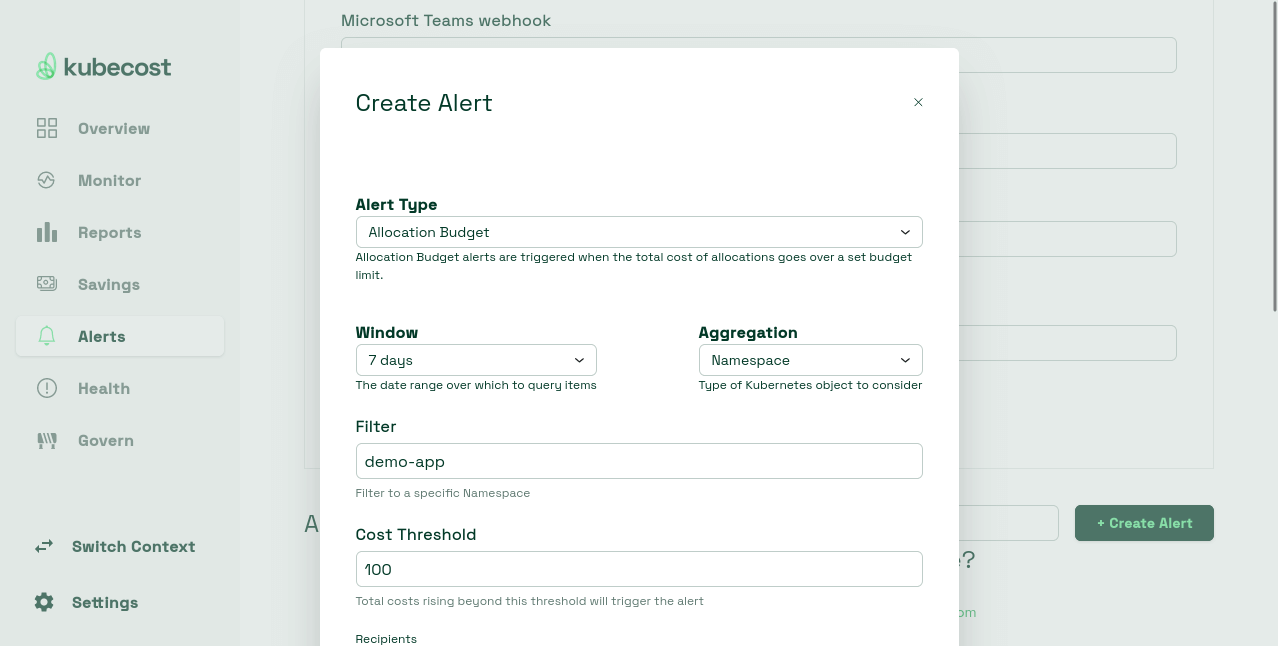
Fill out the form to configure your alert. Select the type of alert first, such as an Allocation Budget change, then choose the time window and aggregation type to filter by. This is similar to customizing the Monitor > Allocations screen.
In the Filter box, select the resource to filter to, then define the cost value in the Cost Threshold input.
Here’s an example of configuring an alert that’ll fire when the costs associated with the demo-app namespace exceed $100 over a 7-day period:
Next, set who’ll receive the alert by adding one or more email addresses under the “Add a recipient” field.
You can choose to use Slack or Microsoft Teams by entering a webhook URL into the relevant inputs.
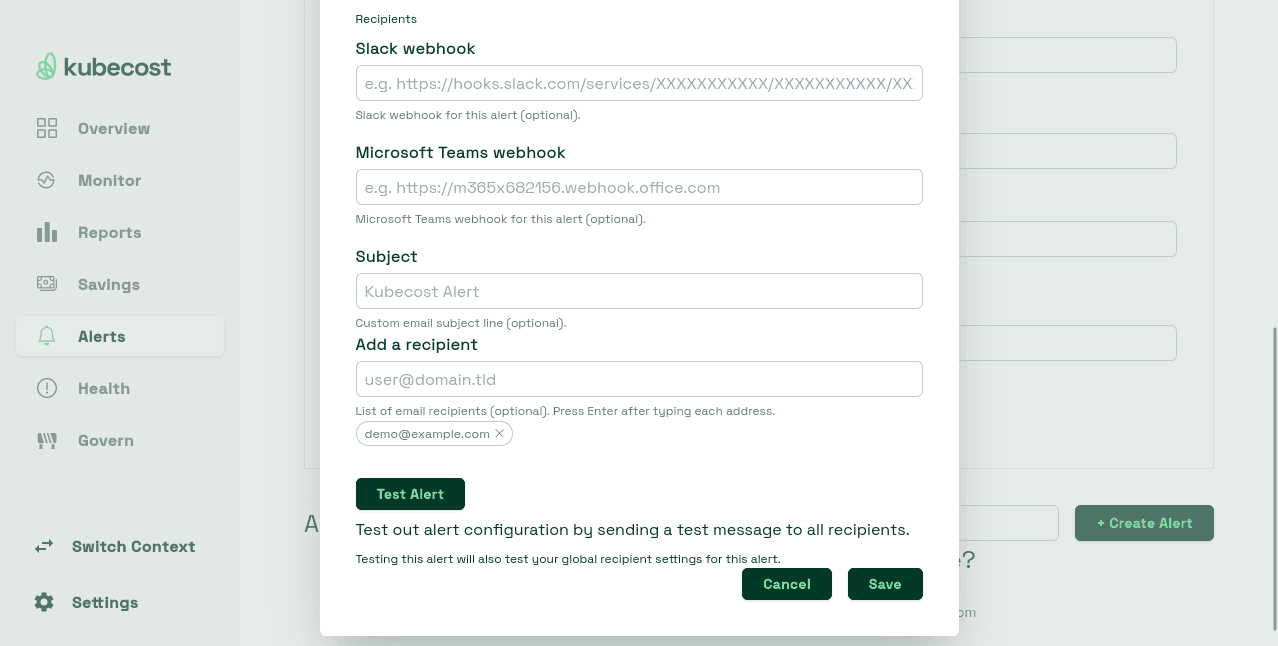
Finally, press the “Test Alert” button to check your configuration, then click “Save” to activate your alert.
Step 8: Use the Kubecost CLI
In addition to its web interface, Kubecost also offers an optional Kubectl extension that lets you access cost data from your terminal.
You’ll need Krew – the Kubectl plugin manager – already installed, then run the following command to add the cost plugin:
$ kubectl krew install costYou can now run kubectl cost commands to view your spending.
1. Costs by node
The kubectl cost node command enumerates spending by each Node in your cluster:
$ kubectl cost node
+-------------+---------------------------+----------------+
| CLUSTER     | NAME                      | MONTHLY COST   |
+-------------+---------------------------+----------------+
| cluster-one | heronweb-8vcpu-16gb-faoam |     229.779784 |
|             | heronweb-2vcpu-4gb-fitr9  |      57.242033 |
+-------------+---------------------------+----------------+
| SUMMED      |                           | USD 287.021816 |
+-------------+---------------------------+----------------+
2. Costs by namespace
The kubectl cost namespace command provides a per-namespace breakdown, including efficiency estimates:
+-------------+----------------------------+--------------------+-----------------+
| CLUSTER     | NAMESPACE                  | MONTHLY RATE (ALL) | COST EFFICIENCY |
+-------------+----------------------------+--------------------+-----------------+
| __idle__    | __idle__                   |         123.201318 |        0.000000 |
| cluster-one | brt1119b-12-production     |          45.633561 |        0.228273 |
|             | kube-system                |          27.518400 |        0.114248 |
|             | abc0822b-40-production     |          23.067993 |        0.174711 |
|             | snapshooter-velero         |          11.760000 |        0.011451 |
|             | kubecost                   |           8.555072 |        1.244261 |
3. Costs by deployment
Similarly, use kubectl cost deployment to view the costs for your Deployment objects:
$ kubectl cost deployment
+-------------+----------------------------+-------------------------------+--------------------+-----------------+
| CLUSTER     | NAMESPACE                  | DEPLOYMENT                    | MONTHLY RATE (ALL) | COST EFFICIENCY |
+-------------+----------------------------+-------------------------------+--------------------+-----------------+
| __idle__    | __idle__                   | __idle__                      |         123.201318 |        0.000000 |
| cluster-one | brt1119b-12-production     | __unallocated__               |          32.004807 |        0.301873 |
|             | kube-system                |                               |          22.339200 |        0.112681 |
|             | abc0822b-40-production     |                               |          15.971079 |        0.211089 |
|             | brt1119b-12-production     | brt1119b                      |          14.471060 |        0.021706 |
4. Other commands
kubectl cost supports several other sub-commands, such as label to filter by label, pod for per-Pod details, and predict to estimate ongoing monthly costs based on current and historical utilization.
Running kubectl cost without arguments will display the help information, including the complete list of supported commands and filtering flags.
Key points
In this article, we’ve shown how Kubecost gives you visibility into your Kubernetes spending. Regularly monitoring Kubecost highlights how costs are allocated and can reveal savings opportunities. In addition to the features covered here, you can also use Kubecost to track spend on infrastructure assets and external cloud integrations. You can find these options under the “Monitor” tab in the sidebar.
Effective Kubernetes cost management is ultimately tied to efficient use of your cluster’s resources. Unused objects, broken deployments, and forgotten self-service environments will increase costs without providing value to your team.
Spacelift helps you stay on top of everything in your clusters, including visualization of your resources, their owners, and estimated costs. Our platform can also discover and resolve drift in your infrastructure, ensuring your configuration remains stable without wasting resources. Start for Free to give it a try!
Manage Kubernetes Easier and Faster
Spacelift allows you to automate, audit, secure, and continuously deliver your infrastructure. It helps overcome common state management issues and adds several must-have features for infrastructure management.
Frequently asked questions
Is Kubecost free?
Yes, Kubecost offers a free tier, but it is limited in scale and features. The open source version provides cost monitoring and visibility for up to a single Kubernetes cluster with basic insights, making it suitable for smaller teams or development environments.
What is the Kubecost tool?
Kubecost is a cost monitoring and optimization tool for Kubernetes environments. It helps teams track, allocate, and reduce cloud infrastructure costs across Kubernetes clusters. Kubecost integrates directly with Kubernetes to deliver real-time visibility into resource usage and maps costs to namespaces, deployments, labels, or teams.
Is Kubecost open source?
Yes, Kubecost is open source, with its core available under the Apache 2.0 license.
