
Continuous integration and continuous delivery (CI/CD) pipelines provide crucial automation for the DevOps lifecycle. They allow you to consistently build, test, and deploy software at scale, without relying on risky manual processes.
Simply configuring CI/CD pipelines isn’t enough, however. You need to regularly monitor your pipelines using precise metrics so you can analyze performance and identify inefficiencies. Without metrics, you can’t know whether your delivery process is improving or deteriorating over time.
This post will list 15 of the most critical CI/CD metrics and KPIs to track. We’ll also discuss best practices to follow when implementing CI/CD monitoring systems. By collecting targeted metrics, you’ll be able to continuously improve your pipelines and build faster, more reliable DevOps workflows.
TL;DR
You should monitor a mix of pipeline performance metrics (duration, success rate, queue times, test flakiness) and DevOps outcome metrics (deployment frequency, change lead time, change failure rate, MTTR) to benchmark your CI/CD health against DORA standards.
Only track what’s actionable, instrument every stage, and use centralized dashboards with automated alerts to catch regressions fast.
Why you should be tracking CI/CD metrics
CI/CD metrics provide the data needed to continuously improve your software delivery lifecycle. Without metrics, developers must rely on intuition or anecdotal feedback to assess how pipelines are performing. Access to accurate real-time metrics allows teams to make informed, data-driven decisions that create meaningful improvements.
Monitoring CI/CD metrics offers three main benefits:
- The ability to assess pipeline speed, stability, and efficiency in quantitative, empirical terms
- Easy, data-backed evaluation of the effects of changes to CI/CD infrastructure and pipeline configurations
- Access to data that reveals how CI/CD systems are contributing to broader DevOps and business objectives
Nonetheless, CI/CD metrics are often overlooked. Teams can be preoccupied with building pipelines, rather than monitoring existing ones. Implementing effective monitoring systems can take time, but the payoff is improved visibility that enables you to increase pipeline performance and reliability.
Key CI/CD metrics to track
Balanced CI/CD monitoring strategies should include a wide range of metrics that span the breadth and depth of your software delivery pipeline. The two main types of metrics to track are:
- CI/CD pipeline performance metrics that focus on your actual pipelines, measuring discrete values such as execution times and success rates
- DevOps outcome metrics that measure how CI/CD adoption impacts your overall software delivery process, such as by assessing change lead times and incident rates
Below is a selection of 15 key metrics that span both of these main categories. Evaluate the options in this list to find the metrics that best align with your own operations. Each metric should be analyzed using a long-term moving average to spot trends and discard occasional anomalies.
1. Pipeline duration
Pipeline duration is the time taken for a pipeline to complete, from start to finish. It measures all the jobs in the pipeline, such as build, test, and deployment stages. Poorly optimized jobs and underpowered CI/CD infrastructure can cause delays.
Why it matters: Longer pipeline durations slow development loops and reduce productivity. Ensuring pipelines complete quickly enables developers to iterate faster and ship new features sooner.
2. Pipeline success rate
This metric expresses the percentage of pipelines that complete successfully, out of the total number of pipelines triggered in a given time period. It allows you to analyze trends in codebase quality and CI/CD reliability.
Why it matters: Low pipeline success rates indicate instability, either within your CI/CD infrastructure, or within your pipeline’s jobs. For example, it could indicate developers don’t have enough time to fully test new changes locally before they push their pull requests.
3. Pipelines triggered per developer
The average number of pipelines triggered per developer over a given timeframe can be a useful indicator of productivity. It provides insights into developer engagement, workflow efficiency, and comparative iteration speed. If some developers are running fewer pipelines than their peers, it may suggest they’re facing bottlenecks that they need help to resolve.
Why it matters: This metric can help you sanity check whether individual developers are experiencing friction in the DevOps lifecycle. It helps you uncover inefficiencies and may reveal poor use of Git Flow committing and merging principles.
4. Pipeline queue lengths and times
Tracking the number of pipelines waiting to be executed, as well as how long they wait, allows you to identify capacity problems within your CI/CD infrastructure. You can then use this data to optimize resource allocations and compare how different infrastructure configurations perform.
Why it matters: Long pipeline queues create development bottlenecks. Developers are kept waiting to get feedback on their changes, reducing productivity and overall throughput.
5. Pipeline and deployment frequency
Pipeline frequency is often a useful measure of your overall DevOps performance. Seeing steady growth in the number of pipelines you run signals team members are able to rapidly create value, within small iterative sprints.
Similarly, measuring the number of pipelines that deploy to production reflects how quickly you deliver that value to end users.
Why it matters: Deployment frequency and iteration speed are two of the main characteristics associated with high-performing DevOps teams. If every change moves through your pipeline, then any sustained increases in pipeline activity indicate you’re on course to increase throughput.
6. Change lead time
Change lead time is a high-level DevOps metric that’s heavily influenced by CI/CD performance. It measures the time taken for code to move from the first commit to deployment in production. You can find this value by comparing the timestamp of the first commit included in pull requests with the time at which the PR reached production.
Why it matters: Shorter change lead times indicate your CI/CD pipelines are highly optimized, so you can rapidly deliver changes to users. This suggests you’re well-equipped to meet evolving market needs.
7. Change failure rate
Change failure rate is the percentage of deployment pipelines that cause new bugs or incidents in production. A common variant is the percentage of deployments that lead to rollbacks, whether they’re triggered manually or automatically in response to an incident. These values reveal whether pipelines are creating the expected outcome for users the first time around.
Why it matters: A high change failure rate indicates your pipeline is allowing issues to reach production unnoticed. It’s therefore crucial to regularly check this value so you can improve stability and provide the best possible experience to customers.
8. Mean Time to Recovery (MTTR)
Mean Time to Recovery (MTTR) is the average time taken to restore service after a failure or incident. It applies both to production environments and to any self-hosted CI/CD runners you operate, since runner downtime directly interrupts your delivery pipeline.
Why it matters: Tracking recovery times allows you to analyze and predict the effects of failures. You can then improve your incident response processes to reduce future downtime.
9. Test coverage
Running tests is one of the main use cases for CI/CD pipelines. Coverage statistics report the percentage of source code that’s targeted by your test suites. Capturing coverage data within your pipelines provides a useful indicator of code quality trends.
Changes reveal whether developers are improving coverage, or causing it to regress — such as by omitting to add test cases for newly implemented changes.
Why it matters: Tracking test coverage within your pipelines allows you to see whether your test suite is keeping pace with the changes made to your codebase. Higher test coverage scores usually mean improved reliability and fewer issues in production.
10. Test flakiness
Flaky tests are tests that run with inconsistent results. They may fail on one attempt, then pass immediately afterward when retried. You can quantify overall flakiness as the percentage of tests or builds that exhibit this behavior.
Reducing flakiness in your pipelines improves reliability by ensuring tests pass the first time, or at least fail consistently.
Why it matters: Flaky tests waste resources, keep developers waiting, and cause confusion. Reducing flakiness improves stability and gives developers confidence that pipelines are working correctly.
11. Pipeline infrastructure costs
This metric tracks how CI/CD pipelines consume DevOps budgets. The compute, storage, and networking resources used by pipelines all have a financial cost, whether it’s for purchasing and powering on-premises infrastructure or using cloud-hosted runners.
Regularly monitoring costs ensures you can balance pipeline performance with spending.
Why it matters: Pipelines must be cost-effective as well as performant. Tracking costs allows you to optimize resource utilization and control your spending. It reveals how changes to pipeline configurations impact your bottom line.
12. Time to fix failing pipelines
The time to fix failing pipelines is a measure of how long it takes to resolve problems caused by incorrect CI/CD configurations. This metric highlights where developer time is being lost due to broken pipelines that need extended resolution work.
Why it matters: Disruption increases the longer that pipelines are in a broken state. If it regularly takes a long time to resolve issues, then your pipelines could be flaky or you may lack CI/CD engineering capacity.
13. Files and commits changed per pipeline
Tracking the average number of files changed and commits made per pipeline approximates the granularity of developer activity.
It’s usually preferable to push many smaller changes as this helps reduce risk and can simplify debugging. However, creating smaller pull requests also increases the overall number of pull requests and pipelines needed per feature. This increases CI/CD infrastructure utilization and related costs.
Why it matters: Tracking trends in the number of changes processed per pipeline can help you balance deployment risk and ease of debugging with pipeline queue times and infrastructure capacity. It allows you to refine your development workflow so changes reach production in the most efficient way possible, without constantly clogging up CI/CD servers.
14. Pipeline cache utilization
Pipeline cache utilization is a measure of how many cached resources are actually used by pipelines. Caching is a crucial mechanism for speeding up pipeline runs, but caching too many resources indiscriminately can create overheads and increase storage use.
Ideally, cache utilization should be consistently high, as this indicates your cached assets are accelerating the majority of builds.
Why it matters: Optimizing cache utilization reduces pipeline durations and helps optimize resource consumption. In comparison, poor cache utilization leads to waste and slowdowns.
15. Overall DevOps cycle time
Your DevOps cycle time is the total time that elapses from work beginning on a new feature, through to the feature’s deployment with any follow-up fixes. Unlike the change lead time metric discussed earlier, cycle time also includes the time taken to plan and design new changes, as well as time taken resolving problems post-release.
Cycle time reveals the efficiency of your entire DevOps workflow. It requires you to analyze CI/CD pipeline activity alongside data from external platforms, such as planning systems that capture when you create new issue tickets. Comparing cycle time before and after you make CI/CD changes lets you evaluate their effects on end-to-end DevOps throughput.
Why it matters: Cycle time offers a holistic view of DevOps delivery efficiency. Optimizing for shorter cycles improves responsiveness, accelerates feedback loops, and reduces time-to-market.
How to monitor CI/CD metrics: best practices
Successfully monitoring CI/CD pipelines depends on more than just the collection of raw metrics data. You must also implement processes that enable you to efficiently utilize collected metrics and generate actionable insights.
Here are five best practices to keep in mind.
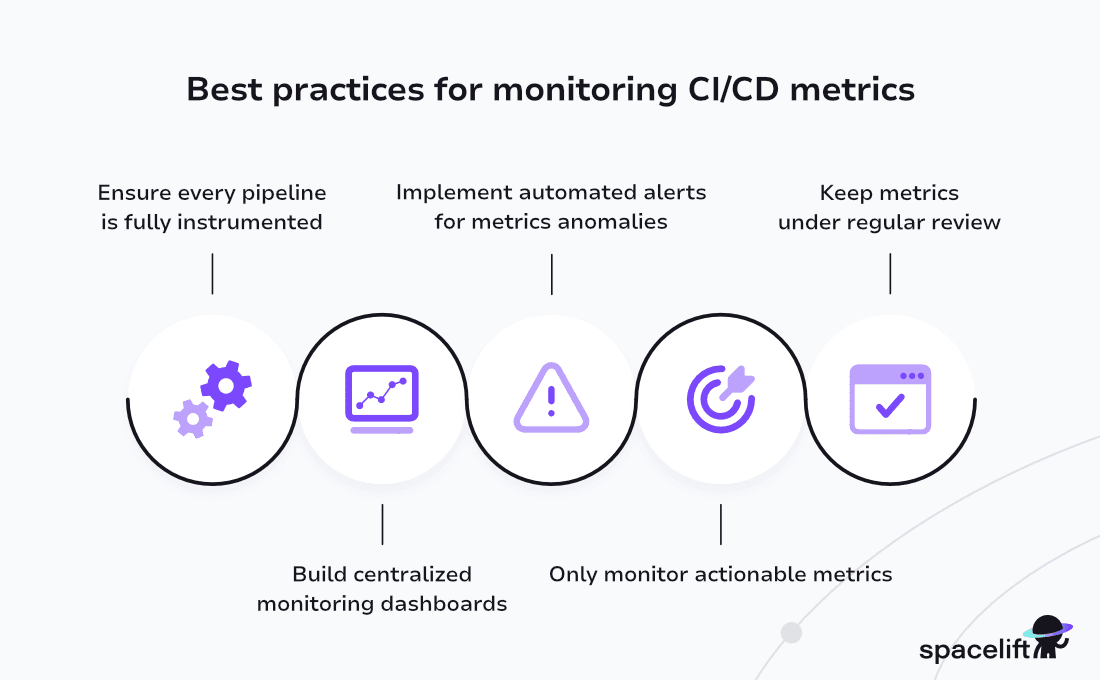
- Ensure every pipeline is fully instrumented – Comprehensive monitoring only happens when your pipelines are fully instrumented to emit metrics at every stage. This means going beyond the default metrics provided by CI/CD services.Emitting your own metrics from within pipeline scripts can yield more granular insights for specific tasks within a build, such as seeing the performance effects of specific commands. Send your performance events to an external observability platform for analysis.
- Build centralized monitoring dashboards – Using observability tools to aggregate CI/CD metrics into centralized dashboards lets you easily identify trends and anomalies using visual patterns. This also helps teams correlate data across different pipelines, repositories, and environments. Customized dashboards let you focus on the insights that matter, reducing the risk of valuable data being submerged in noise.
- Implement automated alerts for metrics anomalies – Enabling real-time alerts for critical events such as elevated pipeline failure rates, increased queue times, or unexplained flakiness helps keep disruption to a minimum. Direct alerts to your team’s chat tools and observability platforms so developers can efficiently triage new anomalies, without having to context-switch between services.
- Only monitor actionable metrics – Not all metrics provide value to every team. If a particular metric isn’t relevant to your operations, then you shouldn’t waste resources tracking it.Monitoring excessively high volumes of metrics risks meaningful changes being obscured. It can also lead to toil and alert fatigue, where genuine issues are ignored because team members have been desensitized by floods of low-quality alerts. Avoid these problems by only collecting metrics that will directly influence your team’s decision-making.
- Keep metrics under regular review – It’s good practice to regularly refine your CI/CD metrics as your priorities evolve over time. Instead of keeping metrics static, revise the list of values you collect so they stay relevant to the changes in your operations. Continually analyzing how you’re using your metrics can help you find coverage black spots and inform further improvements to your pipelines.
How Spacelift can help you improve your CI/CD pipelines
Tracking CI/CD metrics for infrastructure is just as important as tracking them for application code. Without visibility into deployment frequency, lead time, change failure rate, and mean time to recovery, platform teams are flying blind.
Spacelift is the infrastructure orchestration platform built for the AI-accelerated software era. It manages the full lifecycle for both traditional infrastructure as code (IaC) and AI-provisioned infrastructure, orchestrating automated workflows for tools such as OpenTofu, Terraform, CloudFormation, Pulumi, Kubernetes, and Ansible, so teams can plan, review, and apply changes in a repeatable, measurable way.
Spacelift gives platform teams the observability they need to track and improve infrastructure CI/CD metrics across every environment. Everyone works in the same space, supported by robust policies that enforce access controls, security guardrails, and compliance standards. You can measure and optimize your infrastructure delivery pipeline without compromising on safety.

With Spacelift, you get:
- Full run history and audit trails for every stack, giving you the data you need to calculate deployment frequency, lead time to change, and change failure rate across your infrastructure
- Policies to control what kind of resources engineers can create, what parameters they can have, how many approvals you need for a run, what kind of task you execute, what happens when a pull request is open, and where to send your notifications
- Stack dependencies to build multi-infrastructure automation workflows with dependencies, having the ability to build a workflow that, for example, generates your EC2 instances using Terraform and combines it with Ansible to configure them
- Self-service infrastructure via Blueprints and Templates, enabling your developers to do what matters: developing application code without sacrificing control
- Spacelift Intelligence, an AI-powered layer for natural language provisioning, diagnostics, and operational insight across both traditional and AI-driven workflows
- Drift detection and optional remediation, helping you reduce mean time to recovery by catching and resolving configuration drift before it causes incidents
- Creature comforts such as contexts (reusable containers for your environment variables, files, and hooks), and the ability to run arbitrary code
If you want to learn more about Spacelift, create a free account today or book a demo with one of our engineers.
Key points
Monitoring CI/CD pipeline metrics provides the visibility you need to optimize the speed, reliability, and efficiency of automated DevOps workflows. By tracking both technical and outcome-based metrics, you can verify that changes to your pipelines deliver real-world improvements in software delivery.
The metrics we’ve listed should provide a good starting point as you build your CI/CD observability systems. However, it’s critical to choose the right metrics that align with your own operations. Monitoring too few metrics provides limited visibility, while tracking too many values only creates noise and confusion. Aim to strike a balance by focusing on metrics that’ll reveal actionable insights directly relevant to your own operations.
Solve your infrastructure challenges
Spacelift is a flexible orchestration solution for IaC development. It delivers enhanced collaboration, automation, and controls to simplify and accelerate the provisioning of cloud-based infrastructures.
Frequently asked questions
What are the common pitfalls when improving CI/CD metrics?
Optimizing one metric often degrades others, like skipping tests to speed up builds. Vanity metrics such as total deployments can mask poor failure rates. Gaming thresholds and treating metrics as targets rather than diagnostic signals are equally common traps.
What are the most important CI/CD metrics to track first?
Start with build duration, pipeline success rate, deployment frequency, and change failure rate. These four cover speed, stability, and reliability, and map directly to delivery throughput and risk.
How often should CI/CD metrics be reviewed?
Real-time dashboards should surface anomalies continuously. Weekly reviews catch regressions early, while monthly retrospectives are better for spotting trends and evaluating process changes with enough data to be meaningful.
Which CI/CD metrics help improve deployment speed?
Build duration, pipeline queue time, and lead time for changes are the most actionable. Build duration pinpoints slow stages, queue time reveals runner contention, and lead time measures the full commit-to-production path.
How do CI/CD metrics relate to DORA metrics?
CI/CD metrics feed directly into the four DORA metrics. Pipeline data produces deployment frequency and lead time for changes, while post-deploy monitoring yields change failure rate and mean time to restore. DORA is essentially a curated lens on raw pipeline signals.
What tools can be used to monitor CI/CD metrics?
Most platforms offer built-in analytics: GitHub Actions insights, GitLab pipeline analytics, Jenkins plugins. For deeper observability, teams add Datadog CI Visibility, Grafana with Prometheus, LinearB, or Sleuth to aggregate across pipelines and map to DORA benchmarks.
