
Prometheus is the leading time-series database for storing metrics generated by monitoring systems. Beyond observability, it can also be used with other types of time-series data, such as to handle the events generated by IoT sensors.
Because Prometheus is just a database, it’s normally combined with other components to implement a full observability stack.
In this guide, we show how to use Docker Compose to deploy Prometheus and monitor your Docker host. We’ll also highlight how Docker Compose enables you to easily deploy Alertmanager alongside it, letting you receive notifications when metrics change. Docker Compose allows you to run each component in a separate container, providing a simplified management experience.
What we’ll cover:
What is Prometheus?
Prometheus is an open-source database system purpose-built for storing and querying time-series data such as metrics. It’s the leading time-series database solution because it’s performant, easily deployed, and supports powerful queries via its intuitive PromQL query language.

The Prometheus ecosystem includes various components for implementing complete monitoring systems, using Prometheus as the foundation. Some of the most commonly used utilities include:
- Node-Exporter: A tool that generates Linux hardware utilization metrics, ready to be scraped by Prometheus
- Alertmanager: Sends notifications when Prometheus metrics change
- Grafana: A leading data visualization solution that’s often used to create live dashboards from Prometheus data
- Client libraries: Official and community Prometheus client libraries allow you to expose Prometheus metrics from your own applications
A functioning observability stack is therefore more than just Prometheus. If you deploy the database on its own, you can only query metrics manually. A complete metrics generation, visualization, and alerting workflow requires other components working together to create and query Prometheus data.
Why use Docker Compose to deploy Prometheus?
Docker Compose is one of the easiest ways to deploy Prometheus and related components, such as Alertmanager. It lets you configure a stack of containers that you can bring up using a single command. Compose automatically links containers together in a private network, ensuring they can communicate freely.
Some of the key reasons for using Docker Compose to deploy Prometheus include:
- Prometheus is isolated from other workloads on your host: Docker containers are isolated from each other and your host, preventing Prometheus from conflicting with other workloads.
- You can configure your Prometheus deployment as code: Docker Compose uses declarative YAML files to configure your Prometheus deployment, including version, network, and storage details. This ensures consistency across environments.
- It’s easy to deploy Prometheus and all related components using a single command: Compose allows you to run Prometheus and the other components in your observability suite using a single command that starts every container.
These benefits mean Compose is one of the quickest ways to deploy a functioning Prometheus stack. Now let’s see how to use it in practice.
Example setup: How to deploy Prometheus with Docker Compose
To follow this guide, you must have Docker already installed on your host. Docker Compose is included with recent Docker releases, so no additional installation is required.
- Create your docker-compose.yml file.
- Bring your stack up.
- Log in to Prometheus.
- Deploy Node-Exporter and create a Prometheus scrape config.
- Run a test query.
- Configure alerts with Alertmanager.
- Access container logs.
- Stop your Prometheus Docker Compose stack.
Step 1. Create your docker-compose.yml file
Docker Compose uses a YAML file called docker-compose.yml to configure your containers. You can start deploying Prometheus by creating a new directory for your Compose project and then adding a docker-compose.yml file to its root.
Copy the following YAML into the file:
services:
  prometheus:
    image: prom/prometheus:v3.5.0
    volumes:
      - prometheus_data:/prometheus
      - ./prometheus.yml:/etc/prometheus/prometheus.yml
    ports:
      - 9090:9090
    restart: unless-stopped

volumes:
  prometheus_data:
This simple Docker Compose file defines a single service called prometheus. Let’s walk through its configuration:
- The
imageproperty specifies that the container will use theprom/prometheus:v3.5.0image. It’s good practice to use a specific tag (v3.5.0) instead oflatest, as this ensures you won’t unintentionally receive breaking changes when new Prometheus updates are released. - The
volumessection mounts the named volumeprometheus_data(defined later in the file) to the container path /prometheus. This stores your Prometheus data outside the container, preventing it from being lost when your container restarts. - Another volume is also defined: the
prometheus.ymlfile in your working directory is mounted to/etc/prometheus/prometheus.ymlinside the container. This file is where you configure your Prometheus instance. We’ll see it in use in the following sections. - The
portssection binds port 9090 on your host to port 9090 in the container—this is the default Prometheus listening port. It lets you visitlocalhost:9090on your host to access the Prometheus web UI served by the container. restart: unless_stoppedensures the container runs continually while your host is running, until you manually stop it.
Before continuing, create the prometheus.yml config file in your working directory. We’ll use it later in the guide to apply a custom Prometheus configuration.
$ touch prometheus.ymlStep 2. Bring your stack up
You can use your docker-compose.yml file to start your Prometheus instance. Run docker compose up -d to bring up the stack. The -d flag instructs the Compose CLI to detach from the container, so it runs continually in the background.
$ docker compose up -d
[+] Running 3/3
 ✔ Network default           Created                                 0.0s
 ✔ Volume "prometheus_data"  Created                                 0.0s
 ✔ Container prometheus    Started                                 0.2s
You’ll see Docker pull the Prometheus image, create a network for your stack, and then start your container.
Step 3. Log in to Prometheus
With your container running, you’re ready to log in to the Prometheus web UI for the first time. Our docker-compose.yml file configured a port binding on port 9090, so visiting localhost:9090 in your browser should display the UI:

Note: No authentication is needed to access the web UI by default. Do not expose port 9090 in production environments without enabling authentication. You could configure Basic Auth for the Prometheus web server, or run an OAuth proxy in front of your container.
Successfully accessing the UI confirms that Prometheus is working correctly. However, so far, the Prometheus instance is just an empty database: Our configuration doesn’t define any metrics targets to scrape. Let’s change that by deploying Node-Exporter.
Step 4. Deploy Node-Exporter and create a Prometheus scrape config
Node-Exporter is an official component maintained as part of the Prometheus project. It collects and exposes Linux hardware utilization and OS-level metrics in Prometheus format. You can then scrape the data with Prometheus to monitor your hosts.
You can install Node-Exporter directly on your host, but it’s also possible to run it within a Docker container. This approach allows it to be included as part of a Docker Compose monitoring stack.
However, using Node-Exporter with Docker requires some special configuration so the tool can correctly monitor your Docker host system, rather than its own container.
The following example extends the Docker Compose file from above to also deploy Node-Exporter in a second container:
services:
  prometheus:
    container_name: prometheus
    image: prom/prometheus:v3.5.0
    volumes:
      - prometheus_data:/prometheus
      - ./prometheus.yml:/etc/prometheus/prometheus.yml
    ports:
      - 9090:9090
    restart: unless-stopped
  node-exporter:
    container_name: node-exporter
    image: prom/node-exporter:v1.9.0
    command:
      - "--path.rootfs=/host"
    volumes:
      - "/:/host:ro,rslave"
    pid: host
    restart: unless-stopped

volumes:
  prometheus_data:
The service’s command, volumes, and pid fields are set so that the container can access your host’s root filesystem. This enables the Node-Exporter instance within the container to properly monitor your host.
We now have Node-Exporter included as a service in our Docker Compose stack, but Prometheus is unaware of its existence. To solve this, a new scrape configuration must be added to the Prometheus config file at prometheus.yml:
global:

  # Scrape targets every five seconds (default: one minute)
  # This enables data to be gathered quickly for this demonstration
  scrape_interval: 5s

  # Also evaluate alerting rules every five seconds
  # (This will be useful later in this guide)
  evaluation_interval: 5s

scrape_configs:
  - job_name: "node-exporter"
    static_configs:
      - targets: ["node-exporter:9100"]
Want to scrape Prometheus metrics generated by your own application? First, use the Prometheus client libraries to instrument your app, then add another scrape configuration to your prometheus.yml file. Prometheus will then know to scrape your metrics.
The sample configuration shown above adds a job called node-exporter that scrapes metrics from the network address node-exporter:9100. Docker Compose ensures the Prometheus and Node-Exporter containers share the same network, so this address will automatically resolve via Docker’s DNS system. DNS entries are automatically added for Compose services based on their container names.
You can now use the docker compose up -d command to deploy your new Node-Exporter container and apply your updated Prometheus configuration. If you’re following along from earlier, you should also add the --force-recreate flag to force the Prometheus container to restart. This ensures that the new config file is loaded.
$ docker compose up -d --force-recreate
[+] Running 2/2
 ✔ Container node-exporter  Started                                0.5s
 ✔ Container prometheus     Started                                0.6s
Once the containers are running, return to the Prometheus web UI and select Status > Target health from the menu at the top. Within a few seconds, you should see your Node-Exporter target displayed as UP:
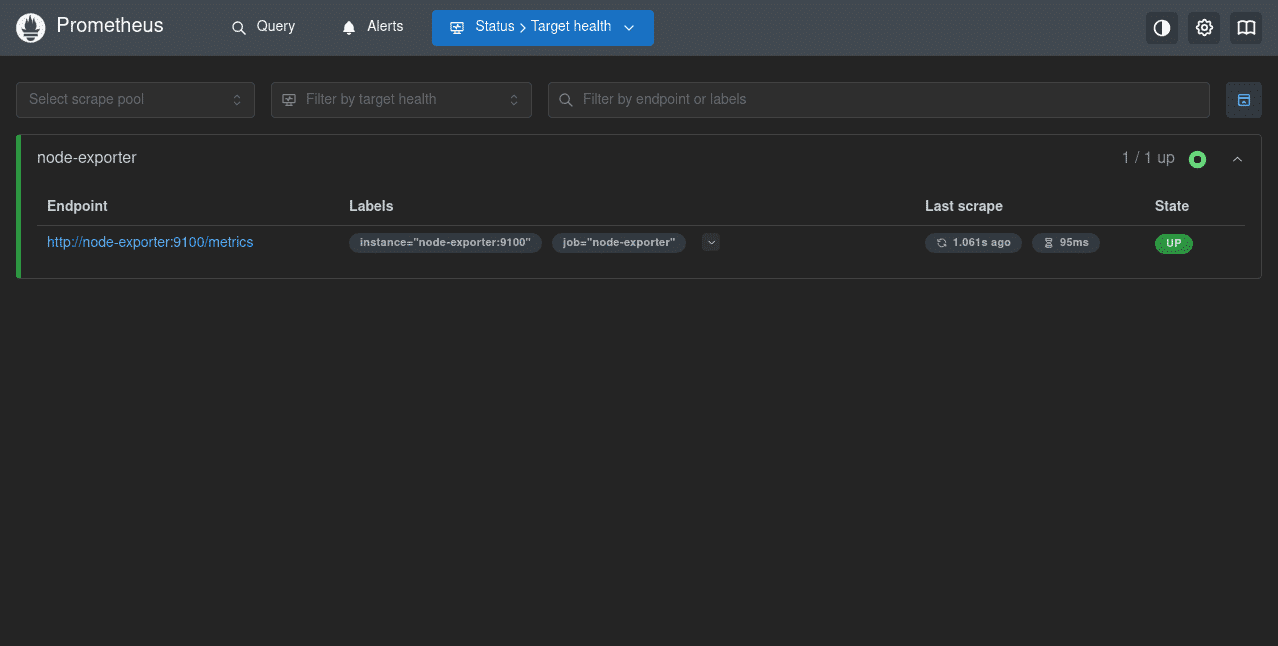
This indicates Prometheus is successfully scraping metrics from the target and storing them within its time-series database. You can begin using Prometheus features to query your metrics.
Step 5. Run a test query
We don’t have space to provide a detailed tutorial for the PromQL query language in this article. However, here’s how to run a few simple queries to prove that your Dockerized Prometheus instance is running correctly.
These queries can be executed in the web UI from the main Query tab.
avg(node_boot_time_seconds)Get the average Node boot time in seconds.

delta(node_hwmon_temp_celsius{chip="platform_coretemp_0", sensor="temp1"}[5m])Get the temperature change reported by the temp1 temperature sensor on the platform_coretemp_0 hardware device, over the past five minutes.

The temperature has gone down by 1°C during the queried time period.
rate(node_network_receive_bytes_total[1m])Get the average network traffic received per second over the last minute.

Step 6. Configure alerts with Alertmanager
At this point, Prometheus and Node-Exporter have been successfully deployed using Docker Compose. Node-Exporter is collecting live metrics from the host, and Prometheus is scraping them, ready for you to query. However, you must remember to manually check Prometheus to identify new problems.
Alertmanager solves this problem. It’s an optional Prometheus component that routes alerts from Prometheus to external services. Supported alert receivers include email, webhooks, chat apps like Slack, and dedicated operations platforms such as PagerDuty.
With Docker Compose, you can easily deploy Alertmanager alongside your Prometheus and Node-Exporter containers. The following docker-compose.yml file expands upon the earlier examples to include Alertmanager as a new service:
services:
  prometheus:
    container_name: prometheus
    image: prom/prometheus:v3.5.0
    volumes:
      - prometheus_data:/prometheus
      - ./prometheus.yml:/etc/prometheus/prometheus.yml
      - ./prometheus_rules.yml:/etc/prometheus/rules.yml
    ports:
      - 9090:9090
    restart: unless-stopped
  node-exporter:
    container_name: node-exporter
    image: prom/node-exporter:v1.9.0
    command:
      - "--path.rootfs=/host"
    volumes:
      - "/:/host:ro,rslave"
    pid: host
    restart: unless-stopped
  alertmanager:
    container_name: alertmanager
    image: prom/alertmanager:v0.28.0
    command:
      - "--config.file=config.yml"
    volumes:
      - ./alertmanager.yml:/alertmanager/config.yml
    ports:
      - 9093:9093
    restart: unless-stopped

volumes:
  prometheus_data:
The alertmanager service configuration is similar to the one used for the Prometheus service:
- Host port 9093 is bound to the container’s port, allowing you to access the Alertmanager web UI on
localhost:9093. - A volume bind mount is used to mount the
alertmanager.ymlfile from your working directory to the Alertmanager config file path in the container. This is where you’ll configure your Alertmanager receivers, such as email server or webhook settings. We’ll create this file below. - Another bind mount has been added to the Prometheus service: It binds
prometheus_rules.ymlfrom your working directory to/etc/prometheus/rules.yml. This file is where you’ll set up the rules that generate alerts. We’ll create it below.
We now need to create the Prometheus rules and Alertmanager config files.
Create an Alertmanager config file
For our guide, we’re using an alertmanager.yml file to store our Alertmanager settings. In the following example, we’re defining an extremely simple webhook receiver that sends new alerts to example.com/webhook.
You can find more information on all the supported receivers and options in the Alertmanager documentation.
route:
  # Route new alerts to the demo-webhook receiver, defined below
  receiver: demo-webhook
receivers:
  - name: "null"
  - name: demo-webhook
    webhook_configs:
      - url: http://example.com/webhook
Enable your Prometheus rules and Alertmanager integration
Finally, create the prometheus_rules.yml file. This is where we’ll define the Prometheus queries that will fire alerts. The following example configures a basic rule that fires when memory usage has been above 80% for more than five minutes:
groups:
  - name: alerts
    rules:
    - alert: MemoryUtilizationHigh
      expr: ((node_memory_MemTotal_bytes - node_memory_MemAvailable_bytes) / node_memory_MemTotal_bytes) * 100 > 80
      for: 5m
      labels:
        severity: warning
      annotations:
        summary: "High memory usage"
        description: "Memory usage is above 80%!"
We must also instruct Prometheus to load the rules from this file and send any alerts to Alertmanager. To do this, edit your main prometheus.yml file and add the following top-level sections:
rule_files:
  - rules.yml

alerting:
  alertmanagers:
    - static_configs:
      - targets:
        - alertmanager:9093
Prometheus will now load rules from /etc/prometheus/rules.yml inside the container. Alerts generated by rules will be sent to the Alertmanager instance at alertmanager:9093. This address is resolvable within our current Docker Compose stack.
Test your alerting system
With these config files, you now have a solution that’ll make an HTTP request to your webhook whenever your host’s memory usage exceeds 80% for an extended period.
To test your configuration, run docker compose up -d --force-recreate again:
$ docker compose up -d --force-recreate
[+] Running 3/3
 ✔ Container alertmanager   Started                                                                                                                     0.8s
 ✔ Container node-exporter  Started                                                                                                                     0.8s
 ✔ Container prometheus     Started                                                                                                                     0.8s
Next, try visiting the Status > Rule health page in the Prometheus web UI to check that the new rule has been detected:

Next, head to the Alerts page to check the rule’s current status. If your host’s memory use is less than 80%, then the alert should show as Inactive. Otherwise, it’ll be Firing.

To test the alert fires correctly, you can try reconfiguring it to reduce the threshold. For instance, the following rule config in prometheus_rules.yml fires when memory use is higher than 10% for five seconds:
groups:
  - name: alerts
    rules:
    - alert: MemoryUtilizationHigh
      expr: ((node_memory_MemTotal_bytes - node_memory_MemAvailable_bytes) / node_memory_MemTotal_bytes) * 100 > 10
      for: 10s
      labels:
        severity: warning
      annotations:
        summary: "High memory usage"
        description: "Memory usage is above 10%!"
After restarting your container stack (docker compose restart or docker compose up -d --force-recreate), you should see the alert soon begins firing, if your system’s memory use is above 10%:

Finally, visit localhost:9093 to check you can access Alertmanager’s own web UI. If an alert is currently firing, then you’ll also see its details displayed within the Finally, visit localhost:9093 to check you can access Alertmanager’s own web UI. If an alert is currently firing, then you’ll also see its details displayed within the Alertmanager UI:

You’ve now successfully set up a simple Alertmanager config that sends you notifications based on Prometheus rule conditions.
Step 7. Access container logs
You may sometimes experience issues with your Prometheus instance deployed via Docker Compose. To begin troubleshooting, you can try accessing the container’s logs.
Docker Compose enables easy access to the logs emitted by your container stack through the docker compose logs command:
$ docker compose logs
prometheus | time=2025-08-25T13:11:42.117Z level=INFO source=main.go:1544 msg="updated GOGC" old=100 new=75
prometheus | time=2025-08-25T13:11:42.118Z level=INFO source=main.go:676 msg="Leaving GOMAXPROCS=8: CPU quota undefined" component=automaxprocs
prometheus | time=2025-08-25T13:11:42.118Z level=INFO source=memlimit.go:198 msg="GOMEMLIMIT is updated" component=automemlimit package=github.com/KimMachineGun/automemlimit/memlimit GOMEMLIMIT=60625900339 previous=9223372036854775807
prometheus | time=2025-08-25T13:11:42.118Z level=INFO source=main.go:718 msg="No time or size retention was set so using the default time retention" duration=15d
You can also livestream new logs to your terminal as they arrive by using docker compose logs --follow.
The docker compose logs command combines the logs from all the services in your stack into a single feed. Each log line contains the name of the container where it originated. For instance, in the example above, the prometheus line prefixes indicate the message came from the first replica of the Prometheus service.
If you’re looking for logs from a specific service, then you can pass its name to the docker compose logs command. For instance, docker compose logs prometheus will only show the logs written by the Prometheus container in our example stack.
Want to learn more advanced options for the docker compose logs command? Check out our dedicated logs guide.
Step 8. Stop your Prometheus Docker Compose stack
Docker Compose allows you to easily stop, restart, or destroy your Prometheus stack. Once you’ve finished experimenting with Prometheus, you might need to do this to take your instance offline, apply configuration changes, or tear down environments.
To stop the containers in your stack, run docker compose stop:
$ docker compose stop
[+] Stopping 1/1
 ✔ Container prometheus  Stopped                                   0.2s
You can then restart your containers using the standard docker compose up -d. If you need to restart containers that are already running, then use docker compose restart instead.
$ docker compose restart
[+] Restarting 1/1
 ✔ Container prometheus  Started                                   0.3s
To remove your containers, run docker compose down. This deletes the containers and networks added by Docker Compose, but retains storage volumes by default.
$ docker compose down
[+] Running 2/2
 ✔ Container prometheus    Removed                                   0.2s
 ✔ Network default         Removed                                   0.1s
Add the -v flag to the command if you also want to destroy your data volumes. This will permanently delete all the data stored by Prometheus, so use this option only if you’re sure you’re finished with your stack.
$ docker compose down -v
[+] Running 3/3
 ✔ Container prometheus    Removed                                   0.2s
 ✔ Volume prometheus_data  Removed                                   0.0s
 ✔ Network default         Removed                                   0.2s
We also encourage you to explore the ways Spacelift offers full flexibility in customizing your workflow. You can bring your own Docker image and use it as a runner to speed up deployments that leverage third-party tools. Spacelift’s official runner image can be found here.
If you want to learn more about what you can do with Spacelift, check out this article, create a free account today, or book a demo with one of our engineers.
Troubleshooting Prometheus and Docker Compose
Having problems using Prometheus with Docker Compose? Here are some quick pointers to help with troubleshooting.
- I’m unable toaccess the Prometheus or Alertmanager web UI: If your Compose stack is running, but the web UI is inaccessible, first check the relevant service’s
portssection in yourdocker-compose.ymlfile. Make sure that a port binding is specified and that you’re connecting to the correct port in your browser. - My Prometheus or Alertmanager rules aren’t being applied: Rules, scrape settings, and other properties for each service must be defined in the correct YAML config file, outside your main
docker-compose.ymlfile. If your settings aren’t applying, then check your docker-compose.yml file mounts the correct files into your containers. - My Prometheus data is lost when my container restarts: Docker requires the use of volumes to store persistent data created by containers. If your volume configuration is incorrect, then your Prometheus data will be lost after restarts. Check the Prometheus service in your
docker-compose.ymlfile has a volume mounted to the container’s/prometheusdirectory. - Prometheus is auto-updating unexpectedly: Prometheus auto-updates may unexpectedly introduce breaking changes that break your deployments. If you find Prometheus has updated after a container restart, check the image tag referenced in your
docker-compose.ymlfile. You should use a pinned tag likeprom/prometheus:v3.5.0to specify an exact version to deploy. Using the default:latesttag will always deploy the very latest version. - I’m experiencing other issues with my deployment: You can debug other types of issues by viewing the logs generated by your containers. Run
docker compose logs --followcommand within the directory containing yourdocker-compose.ymlfile. This will allow you to see any error messages or warnings emitted by the containers in your stack.
If you continue to experience problems after following the suggestions above, try the troubleshooting steps provided in the documentation for the specific component that is affected.
Key points
Deploying Prometheus with Docker Compose allows you to operate the time-series database as an isolated container. You can configure your deployment using simple YAML files that you can reuse across environments. It’s also easier to simultaneously deploy adjacent components, such as Alertmanager and Node-Exporter. You can deploy an entire observability stack using a single docker compose up command.
Docker Compose is ideal when you’re experimenting with Prometheus locally or working in smaller environments. However, it’s less suitable if you need to operate your monitoring system at scale and require high availability.
You can adapt to those scenarios by running Prometheus within Kubernetes using solutions like kube-prometheus-stack. This automates the process of deploying and operating Prometheus, Grafana, and Alertmanager in Kubernetes, including automatic monitoring for the host cluster itself. Check it out and get started with our Prometheus Monitoring for Kubernetes guide.
Solve your infrastructure challenges
Spacelift is a flexible orchestration solution for IaC development. It delivers enhanced collaboration, automation, and controls to simplify and accelerate the provisioning of cloud-based infrastructures.
