

Your run has been in planning for 11 minutes, and you can’t tell whether the AWS provider is still downloading or GitHub is having another bad day. The logs give you a total run time with no split across init, plan, and apply, so you re-run with TF_LOG=DEBUG and scroll through the output hoping the second attempt tells you more than the first.
In our survey of 60 Spacelift users, 86% troubleshoot a slow or failed run every week, and almost half paste run logs into an external AI tool like ChatGPT to find the cause. Application teams have had these answers at their fingertips via distributed tracing for years. Infrastructure runs are still flying blind.
OpenTofu keeps shipping what practitioners ask for, and its native OpenTelemetry tracing goes straight at this problem by emitting spans for init, plan, and apply. We contributed to that work upstream, and Spacelift is the first platform to put it to use. Each run on an OpenTofu native stack now tells you why it slowed down or failed and what to fix.
The best part is that you don’t have to do anything to make it work in Spacelift. It is already set up and enabled. Just hit the Observability tab, and see it in action. This is a big difference from using OpenTofu by itself and needing to take several extra steps to get the same results.
Know why your run is slow before anyone asks
Spacelift Run Observability reads OpenTofu’s OpenTelemetry traces to give you insights into how your runs are performing, and each finding points to a problem source.
Let’s say GitHub goes down mid-run and init stalls on a provider or module download. The phase timeline shows the init running far past its baseline, and the slowest provider install list names the download that hung.
Large providers often take longer to install than your plan takes to run, which is why install time gets its own breakdown and a finding that points you to a provider plugin cache, for orgs on private workers. One beta team didn’t know their installs were slow until the breakdown showed it. When one resource consumes the apply, the slowest resource list shows it by address, and a database cluster that took up most of an eight-minute apply sits at the top.
Spacelift compares every run against the stack’s typical run time, which makes regressions easy to spot. When a run fails, you see the failing phase and the error message pulled from the trace, and you can skip the debug re-run.
Get the answer and the evidence on one tab
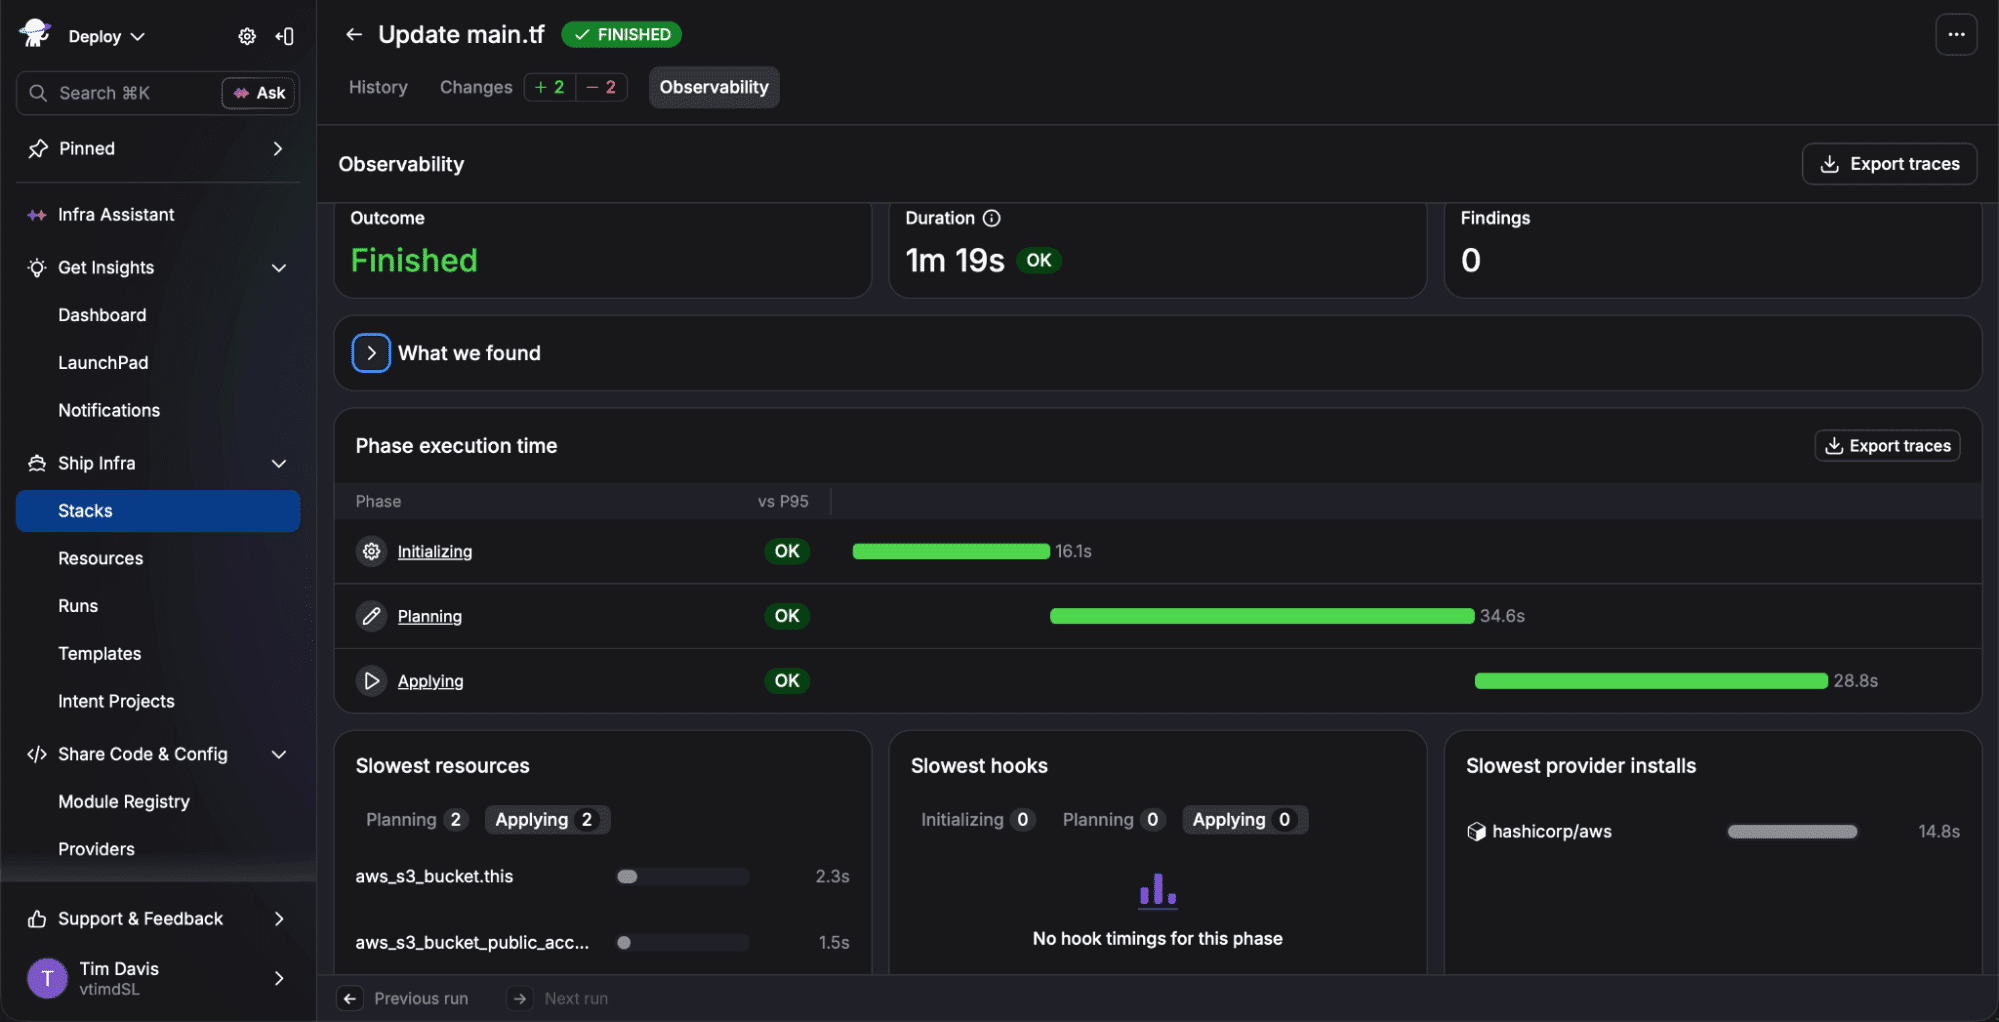
Every run on an OpenTofu native stack gets an Observability tab that gives you data-backed insights into your performance. Here’s what’s on it:
| Feature | What you get |
| Get findings with a fix | Get natural language explanations for why your runs are slow or failing and tips on what to fix. |
| Break down every run by phase | See how much time you spend initializing, planning, and applying. Get insights into outliers. |
| Spot the slowest resources | Understand the resources that ate the most time in each phase, by address. |
| Catch slow provider installs | View download and install times so you can cache heavy providers instead of downloading them every run. |
| Jump to the real error | See which phase failed and the exact error up front, so you can fix it without a debug re-run. |
| Track runs against your baseline | Measure every run against the stack’s typical run time so you can spot regressions. |
In testing, 87% of users reached the answer faster with findings than with a raw trace, and 90% still wanted the underlying data on hand to verify it, so Run Observability puts each finding next to the timing data behind it.
Get findings without running a collector
On an OpenTofu native stack, the Spacelift worker automatically collects OpenTofu’s spans as the run executes and assembles a single trace per run, as opposed to running open source OpenTofu where you have to stand up an observability backend or an OpenTelemetry collector to make it work.
Spacelift evaluates that trace against a set of rules and the stack’s run history, and writes the results to the run’s Observability tab as findings. Terraform stacks don’t get findings, because Terraform doesn’t expose provider install or per-resource timing.
Built for OpenTofu
Spacelift is a founding member of the OpenTofu project, and more than half of all Spacelift runs are now OpenTofu runs. We helped build tracing into OpenTofu itself, so Run Observability works best on OpenTofu native stacks, where you get every finding.
The next step we are looking at implementing is OpenTelemetry Protocol (OTLP) export, which sends run traces to Datadog, Grafana Tempo, Honeycomb, New Relic, or any OTLP-compatible backend, so the alerts you already run cover IaC too.
See it on your next run
Run Observability is generally available today on OpenTofu native stacks. We’ll walk through it live during OpenTofu Day at KubeCon, and the OpenTofu Observability webinar on November 19.
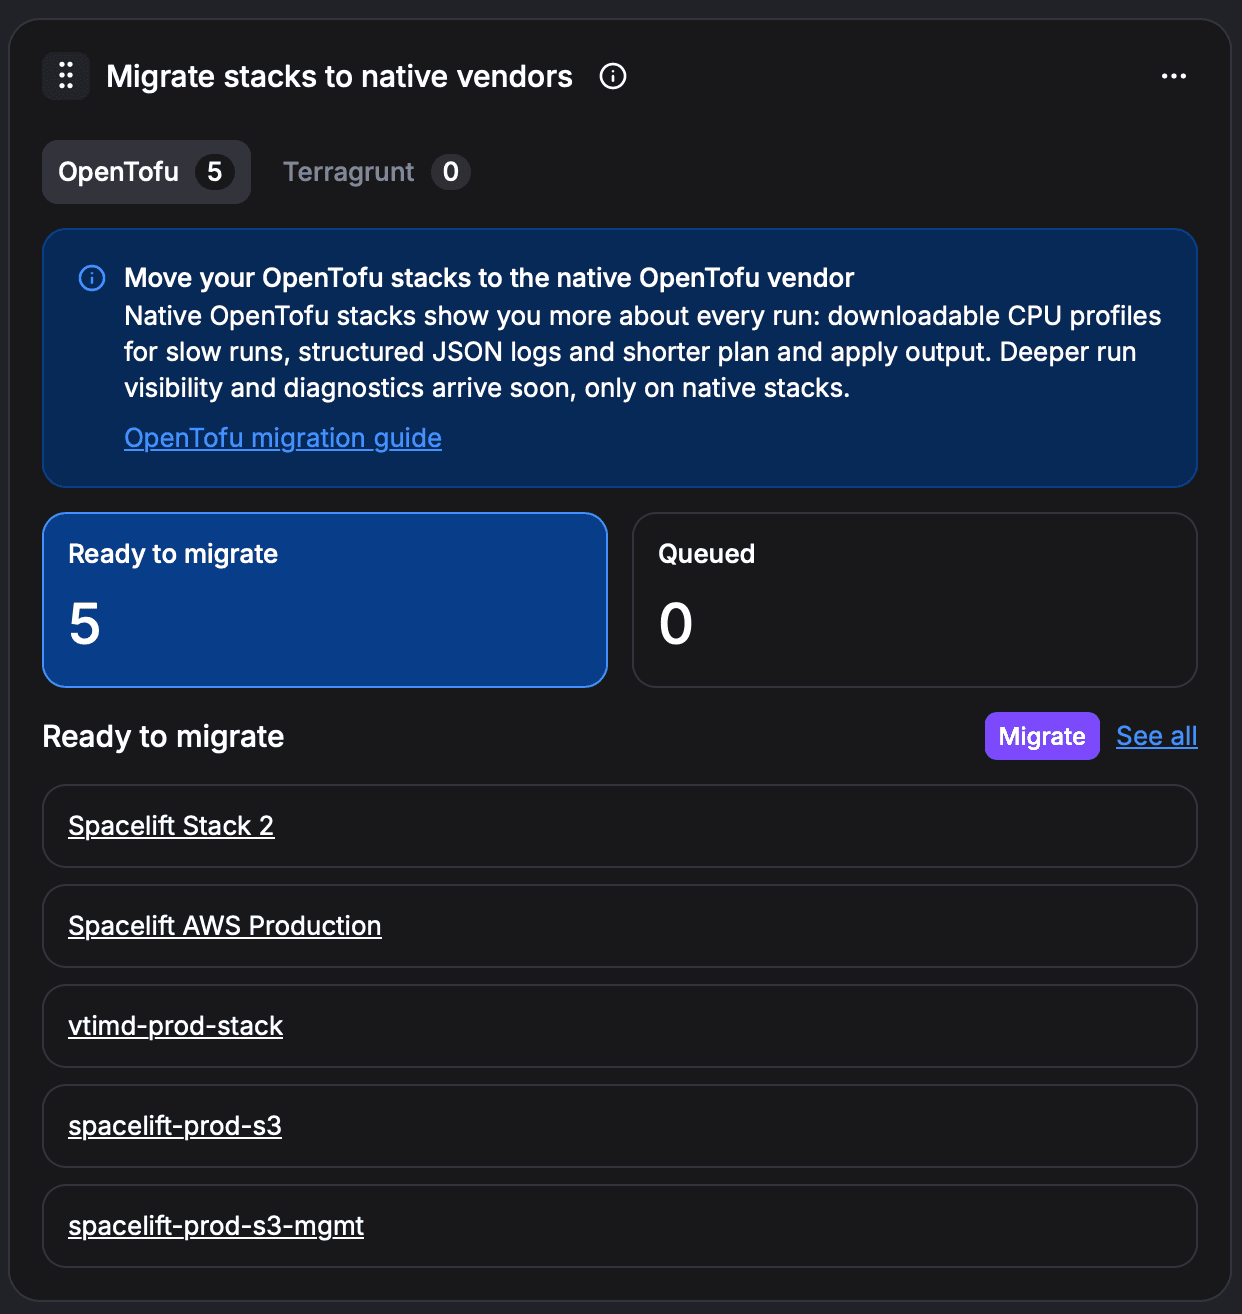
If you’re already running Terraform stacks on OpenTofu, migrate them to OpenTofu native stacks to start using Run Observability.