
The average data breach now costs a whopping $4.88 million. As you let that number sink in, consider that the top single factor that reduces breach costs is a DevSecOps approach, saving organizations $227,192 per incident, more than any other security investment on record.
That gap between organizations that have embedded security into their development lifecycle and those that haven’t is widening every year. Data related to breaches, vulnerabilities, and supply chain attack rates all point to DevSecOps implementation as an essential requirement for organizations shipping software at speed.
In this article, we examine the state of DevSecOps in 2026 with the aim of helping you make better decisions about where to invest and what to fix.
Top DevSecOps statistics
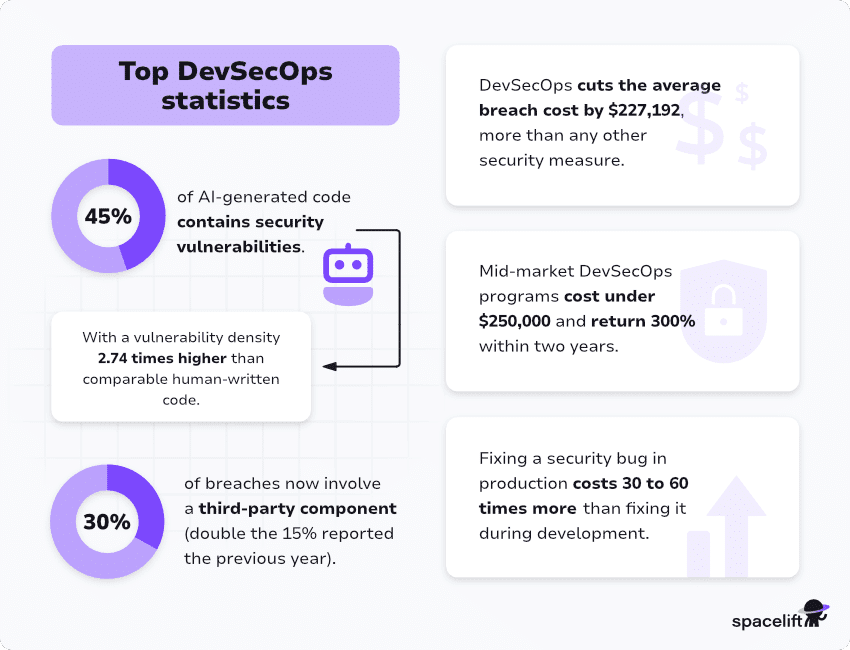
- DevSecOps is the single top breach-cost mitigator, cutting average breach cost by $227,192, more than AI/ML security insights or security analytics.
- Mid-market DevSecOps programs cost under $250,000 and return 300% within two years.
- 45% of AI-generated code contains security vulnerabilities, with a vulnerability density 2.74 times higher than comparable human-written code.
- Fixing a security defect in production costs 30 to 60 times more than fixing it during development.
- 30% of breaches now involve a third-party component, double the 15% reported the previous year.
The real cost of a breach
The cost of a data breach includes lost business, legal exposure, detection and response, notification, and post-breach remediation. It does not capture reputational damage, which is harder to quantify but equally real.
- The global average cost of a data breach reached $4.88 million in 2024, a 10% increase from the previous year and the largest single-year rise since the pandemic.
- In the United States, that number climbed even higher to a record $10.22 million, up 9% year-over-year.
- The average data breach lifecycle in 2025 was 241 days, a nine-year low, but still more than eight months of exposure before an incident is fully contained. The lifecycle breaks down into 158 days to identify the breach and 83 days to contain it. If you’re measuring your security program’s maturity, time-to-detect is one of the most realistic indicators you have.
- Breaches detected and contained in under 200 days cost an average of $3.61 million.
- Breaches that take longer than 200 days cost $5.49 million, a $1.88 million difference for letting an incident linger. Every day you delay is a cost multiplier.
- 70% of breached organizations in 2024 reported significant or very significant disruption to their operations. The financial cost is often what grabs attention, but the operational cost is the truly damaging factor.
Where DevSecOps adoption actually stands
Although headline adoption numbers for DevSecOps look promising, the reality is more sobering.
- 36% of organizations now develop software using DevSecOps practices, up from 27% in 2020. However, 36% is still a minority of the industry, and adoption does not mean mature usage.
- 56% of developers say their organization uses a DevSecOps approach, up 9% from the previous year.
- Just 17% say DevSecOps is incorporated into all of their application development, but this is up from 13% in 2023.
- 74% of security professionals have already shifted left (or plan to, which is not the same thing) in the near future.
- The DevSecOps market is projected to reach $20.24 billion by 2030, growing at a CAGR of 13.2%.
- The market is forecast to reach $31.96 billion by 2034.
- 96% of security and operations professionals see clear benefits in automating security and compliance as part of the development pipeline.
The shift-left case in numbers
The argument for finding security defects early rather than late has been made in research for decades. The most recent data certainly supports that argument.
- Fixing a security defect in production costs between 30 and 60 times more than fixing the same defect during development. The 60x figure applies specifically to security vulnerabilities, where the cost of a live exploit, regulatory exposure, and post-breach remediation compounds the base remediation cost.
- Mature DevSecOps programs reduce production vulnerabilities by between 60% and 70%, while catching an additional 40 to 50% of issues during the coding phase, where fix costs are minimal.
- Organizations with mature DevSecOps practices deploy up to 208% more often than low-performing teams, with lead time for changes reduced by 66%.
- Organizations with high DevSecOps adoption save approximately $1.7 million per breach compared to those with low or no adoption.
Vulnerability exploitation: the gap between found and fixed
Even with a comprehensive scanning program, critical exposure windows appear if your remediation process is broken.
- In 2025, there was a 34% rise in successful vulnerability exploitation as an initial access method in 2025.
- After a 180% spike in 2024, exploitation now accounts for 20% of all data breaches, just two percentage points below credential abuse.
- The percentage of exploitation actions targeting edge devices and VPNs jumped from 3% in 2024 to 22% in 2025, an almost 8X increase in a single year.
- Only 54% of vulnerabilities were fully remediated in 2025, and the median time to patch was 32 days.
- For critical vulnerabilities in edge devices, the median time between public disclosure and mass exploitation by attackers was zero days in 2025.
- 52% of development teams regularly fail to meet their vulnerability SLA deadlines, even though 74% of those teams set SLAs of a week or less.
Software supply chain: the threat your scanning doesn't cover
Although your direct dependencies may get scanned, your dependencies’ dependencies often don’t, and that creates a supply chain problem. Malicious packages are being published at scale, and the ecosystem tooling that catches typosquatting and dependency confusion attacks is not universally deployed.
- 30% of breaches now involve a third-party component, double the 15% reported the previous year.
- Sonatype logged 512,847 new malicious packages in 2025, a 156% increase from the previous year. The total number of malicious packages tracked since Sonatype began monitoring has exceeded 778,500.
- Only 62% of organizations have adopted SBOM monitoring, and only 50% have pipeline security controls in place.
- Fewer than 25% of organizations perform regular audits of their software supply chain.
- 25% of development teams track only direct dependencies, and almost 5% don’t track any.
AI-generated code: your fastest-growing attack surface
AI coding assistants are now mainstream. Organizations are shipping significant amounts of AI-generated code into production, using security scanning programs designed for teams of developers writing code at human speed. The security implications of this shift are only beginning to surface in the data.
- Tests of more than 100 large language models found that 45% of AI-generated code contains security vulnerabilities.
- The vulnerability density in AI-generated code is 2.74 times higher than in comparable human-written code.
- 70% of organizations estimated that more than 40% of their codebase was AI-generated by 2024.
- 92% of security leaders say they are concerned about the security implications of that trend.
- 80% of developers say they trust AI tool output without systematic security review, while 59% admit to worrying about the vulnerabilities those tools introduce.
- By June 2025, AI-generated code was producing more than 10,000 new security findings per month across studied repositories, a 10X increase from December 2024.
- AI coding tools fail to prevent cross-site scripting vulnerabilities in 86% of test cases.
- Log injection vulnerabilities appear in 88% of AI-generated code scenarios.
Container and cloud-native security
Kubernetes has become the default deployment foundation for cloud-native workloads, but the security profile of that choice is not broadly understood.
- 90% of organizations experienced at least one Kubernetes security incident in the past year, reflecting how quickly organizations adopted container orchestration without building the security practices to match.
- 59% of organizations reported security incidents specifically in their Kubernetes or container environments, with network breaches, API vulnerabilities, and certificate misconfigurations the primary causes.
- Misconfigurations account for 45% of Kubernetes security incidents.
- 67% of organizations say they have delayed or slowed application deployment due to Kubernetes security concerns.
The skills gap
The cybersecurity workforce shortage is a frequently cited challenge, with recent data revealing specific details about both the scale and the nature of the gap.
- The 2024 ISC2 Cybersecurity Workforce Study estimated a global gap of 4,763,963 cybersecurity professionals, a 19.1% increase from 2023. However, ISC2 stopped publishing a headcount gap figure in 2025 citing that respondents increasingly identified the skills gap as a more urgent concern than the headcount gap.
- 59% of cybersecurity leaders reported critical or significant skills needs in 2025, up from 44% in 2024.
- Application security is cited by 28% of respondents, behind AI security (41%) and cloud security (36%).
- 88% of organizations have experienced at least one significant security consequence as a direct result of their skills shortage.
- 27% of organizations report breaches directly linked to capability gaps in their teams.
- 33% of organizations say they lack the budget to adequately staff their security teams.
Toolchain sprawl and the consolidation problem
More tools do not equal better security. Platform consolidation is the central challenge in application security maturity. The most constrained organizations are the ones with too many tools that don’t share data, requiring manual triage to produce any coherent view of risk. If your security findings are spread across too many dashboards with no unified prioritization, your team is spending more time managing tool output than fixing vulnerabilities.
- A Gartner survey of 162 large enterprises, conducted in 2024, found that organizations use an average of 45 cybersecurity tools.
- 60% of development teams use more than five tools for their software development process, and 49% use more than five AI tools specifically.
- Teams lose an average of seven hours per team member per week to AI-related inefficiencies, most of which are caused by tool fragmentation and context switching.
- 72% of global enterprises with 500 or more employees have integrated SAST tools into their development pipelines.
- 50% of organizations run SAST (Static Application Security Testing), 44% run DAST (Dynamic Application Security Testing), and roughly 50% run container and dependency checks.
The ROI case
Teams that look at the investment side only are often skeptical about DevSecOps ROI. However, there is substantial evidence of positive returns.
- IBM’s 2025 analysis identifies the DevSecOps approach as the single top cost mitigator across all breach scenarios, with a $227,192 reduction in average breach cost. The next-closest mitigators are AI and ML security insights ($223,503) and security analytics ($212,061).
- Organizations with high DevSecOps adoption save approximately $1.7 million per breach compared to those with low adoption. With a global average breach cost of $4.88 million, that is a 35% reduction in breach cost for organizations that have made the shift.
- Teams using DevSecOps deploy 208% more frequently than low-performing teams, and lead time for changes is reduced by 66%.
- Mid-market DevSecOps programs typically cost under $250,000 to implement, with analysis showing a 300% return within two years when breach avoidance, rework reduction, and deployment velocity improvements are modeled together.
- Organizations with a strong focus on using AI saved an average of $1.88 million on breach costs.
What the numbers mean
Vulnerability exploitation is accelerating. Patch windows are reducing to zero for critical vulnerabilities, yet organizational median remediation time sits at 32 days. Supply chain attacks are up 100% year-over-year in breach involvement, and AI-generated code is shipping at scale with 2.74x the vulnerability density of human-written code. Meanwhile, the skills gap shows no sign of shrinking, and organizations that have not embedded security into their development pipeline are spending $1.7 million more per breach than those that have.
However, the data also reveals that the organizations making the shift to DevSecOps are seeing real returns. They experience fewer production vulnerabilities, faster deployment cycles, and lower breach costs, and their security teams spend time working on real issues instead of manually triaging tool output.
DevSecOps is a set of practices that compound long after you adopt them. The organizations that invest in building their DevSecOps foundation now are the ones whose breach statistics will look different in next year’s article.
Solve your infrastructure challenges
Spacelift is an infrastructure orchestration platform built for IaC. It brings collaboration, automation, and governance into a single workflow, so your team can provision cloud infrastructure faster without losing control.
Spacelift. 60+ Key Data Breach Statistics for 2026. Accessed: 26 June 2026.
IBM. Cost of a Data Breach Report 2025. Accessed: 26 June 2026.
IBM. IBM Report: Escalating Data Breach Disruption Pushes Costs to New Highs. Accessed: 26 June 2026.
GitLab. GitLab Global DevSecOps Report. Accessed: 26 June 2026.
Fortune Business Insights. DevSecOps Market Size, Share & Global Growth Report [2034]. Accessed: 26 June 2026.
Verizon. 2025 Data Breach Investigations Report. Accessed: 26 June 2026.
Snyk. 2024 State of Open Source Security. Accessed: 26 June 2026.
Sonatype. 10th Annual State of the Software Supply Chain Report. Accessed: 26 June 2026.
Sonatype. Sonatype’s 10th Annual State of the Software Supply Chain® Report Reveals 156% Surge in Open Source Malware. Accessed: 26 June 2026.
Veracode. AI-Generated Code: A Double-Edged Sword for Developers. Accessed: 26 June 2026.
Red Hat. Kubernetes Adoption, Security, and Market Trends Report 2024. Accessed: 26 June 2026.
Red Hat. The State of Kubernetes Security in 2024. Accessed: 26 June 2026.
ISC2. 2025 ISC2 Cybersecurity Workforce Study. Accessed: 26 June 2026.
ISC2. Results of the 2024 ISC2 Cybersecurity Workforce Study. Accessed: 26 June 2026.
Industrial Cyber. SANS 2026 Report Flags Cybersecurity Skills Crisis, Putting Critical Infrastructure and OT Sectors at Measurable Breach Risk. Accessed: 26 June 2026.
Gartner. Application Security Strategy 2026: AI, DevSecOps and Platform Consolidation. Accessed: 26 June 2026.
Sonatype. AI, DevSecOps, and the Future of Application Security: The Gartner® Report. Accessed: 26 June 2026.
StrongDM. 30+ DevSecOps Statistics You Should Know in 2026. Accessed: 26 June 2026.
DeepStrike. DevSecOps Statistics 2026: Shift-Left, AppSec Gaps & Testing Trends. Accessed: 26 June 2026.
DORA. DORA Research Program. Accessed: 26 June 2026.