In this blog post, we will install Prometheus on K8s using Helm charts. We will also customize the Prometheus configuration via Helm charts to connect various node exporter instances to expose their metrics on Prometheus.
Various components that make an application run on Kubernetes are defined in the declarative format in configuration files. Depending on the complexity of applications being deployed, the number of configuration files/manifests may pose some management difficulties.
Helm is a package manager for Kubernetes that simplifies application deployment and management by providing a higher-level abstraction for manifest files. It streamlines deployment by packaging the Kubernetes manifests into a single Helm chart, which can be installed and uninstalled consistently any number of times.
The Helm architecture is based on three big concepts: chart, repository, and release. A Helm chart is a compilation of Kubernetes manifest files, a repository is a place where all the charts are versioned and maintained, and an instance is a single installation of a chart. In this blog post, we will use the community-developed Helm chart for Prometheus.
See also Kustomize vs Helm comparison.
Prometheus is an open-source monitoring and alerting tool designed for monitoring of applications orchestrated by platforms like Kubernetes. Its architecture is based on a time-series database and a robust alerting system that enables querying and visualization using tools like Grafana.
The diagram below represents Prometheus components.
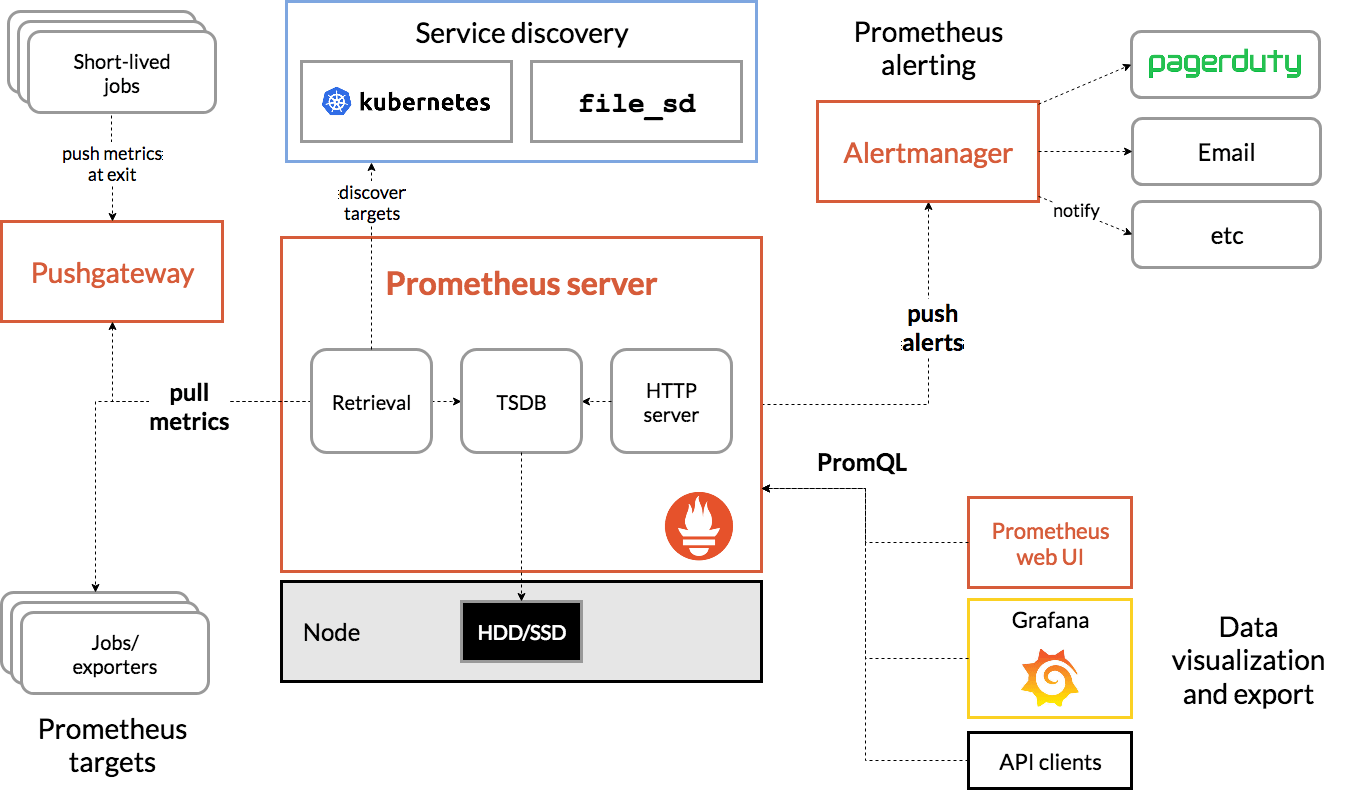
The primary component of Prometheus is the server, which is responsible for collecting and storing time-series data. The server periodically scrapes metrics from targets such as applications, services, or infrastructure components and stores them in a time-series database.
The Prometheus Query Language (PromQL) enables us to retrieve and manipulate this data for analysis and visualization. The data model is based on key-value pairs and timestamps. It excels at providing real-time insights into system performance, resource utilization, and app health.
Then, Prometheus’s alerting system allows us to define rules based on metrics and trigger alerts when specific conditions are met to proactively address the issues.
A node exporter is an exporter designed to export system metrics to Prometheus’s Push Gateway. Exporters are agents that expose metrics from various systems in a format Prometheus can understand. They act as connectors between Prometheus and different system components.
Additionally, Grafana — a popular open-source dashboard and visualization platform — is often used in conjunction with Prometheus to create visually appealing and insightful representations of the monitored data.
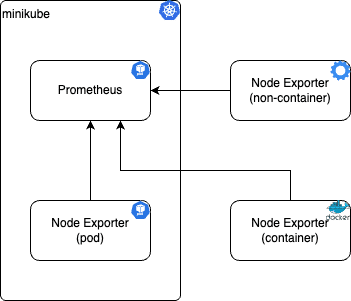
There are three ways to install the node exporters and connect Prometheus to collect metrics from them:
- On the K8s as a pod
- As an independent Docker container
- As non-containerized instance
The diagram below shows the final result of the steps we will follow in this article:
Step 1: Install Prometheus using Helm chart
Download the appropriate files based on the OS and processor architecture and run the executable to install the Prometheus locally or on a VM instance.
The download comes with a sample configuration file named “prometheus.yml” to further configure the targets to listen to. Use the same to define targets, rules, and other configuration options, and run Prometheus again. These steps are usually automated by using Docker or by implementing configuration management tools.
There are a couple of main ways to install Prometheus in a Kubernetes environment. We can do it manually or by using Helm charts.
As we have seen in previous sections, Prometheus installation depends on multiple components, such as the alert manager and push gateway. To achieve this manually, we would need to create Kubernetes configuration files for deployment, services, config maps, etc.
Kubernetes environments typically support microservice-based architecture, which involves deploying multiple instances of software components that support various services. Managing configuration files for all of these can get tedious. This is where Helm charts are used. Like Prometheus, there could be other applications that are not the services themselves, but they do perform important secondary operations.
Using Helm charts is a better way to deploy Prometheus on Kubernetes.
To install Prometheus using Helm, we first add and update the prometheus-community Helm repository by running the commands below:
helm repo add prometheus-community https://prometheus-community.github.io/helm-charts
helm repo update
The steps above add the repository and the charts for Prometheus deployment.
Install the charts by providing a release name as shown below:
helm install [RELEASE_NAME] prometheus-community/prometheusThe steps above add the repository and the charts for Prometheus deployment.
Install the charts by providing a release name as shown below:
helm install [RELEASE_NAME] prometheus-community/prometheusIn the example included in this blog post, we will call this release “prometheus”.
The updated command looks like this:
helm install prometheus prometheus-community/prometheusThe output below indicates that the Helm chart for Prometheus is successfully installed.
NAME: prometheus
LAST DEPLOYED: Sun Mar  3 21:55:58 2024
NAMESPACE: default
STATUS: deployed
REVISION: 1
TEST SUITE: None
NOTES:
The Prometheus server can be accessed via port 80 on the following DNS name from within your cluster:
prometheus-server.default.svc.cluster.local


Get the Prometheus server URL by running these commands in the same shell:
  export POD_NAME=$(kubectl get pods --namespace default -l "app.kubernetes.io/name=prometheus,app.kubernetes.io/instance=prometheus" -o jsonpath="{.items[0].metadata.name}")
  kubectl --namespace default port-forward $POD_NAME 9090


The Prometheus alertmanager can be accessed via port 9093 on the following DNS name from within your cluster:
prometheus-alertmanager.default.svc.cluster.local


Get the Alertmanager URL by running these commands in the same shell:
  export POD_NAME=$(kubectl get pods --namespace default -l "app.kubernetes.io/name=alertmanager,app.kubernetes.io/instance=prometheus" -o jsonpath="{.items[0].metadata.name}")
  kubectl --namespace default port-forward $POD_NAME 9093
#################################################################################
######   WARNING: Pod Security Policy has been disabled by default since    #####
######            it deprecated after k8s 1.25+. use                        #####
######            (index .Values "prometheus-node-exporter" "rbac"          #####
###### .          "pspEnabled") with (index .Values                         #####
######            "prometheus-node-exporter" "rbac" "pspAnnotations")       #####
######            in case you still need it.                                #####
#################################################################################


The Prometheus PushGateway can be accessed via port 9091 on the following DNS name from within your cluster:
prometheus-prometheus-pushgateway.default.svc.cluster.local


Get the PushGateway URL by running these commands in the same shell:
  export POD_NAME=$(kubectl get pods --namespace default -l "app=prometheus-pushgateway,component=pushgateway" -o jsonpath="{.items[0].metadata.name}")
  kubectl --namespace default port-forward $POD_NAME 9091

For more information on running Prometheus, visit:
https://prometheus.io/
To view all the Kubernetes components installed, run kubectl get all command. It should present you with an output similar to below.
NAME                                                     READY   STATUS    RESTARTS   AGE
pod/prometheus-alertmanager-0                            1/1     Running   0          3m1s
pod/prometheus-kube-state-metrics-78d874fb59-5cbfh       1/1     Running   0          3m1s
pod/prometheus-prometheus-node-exporter-v9cbf            1/1     Running   0          3m1s
pod/prometheus-prometheus-pushgateway-8647d94cf6-twh4s   1/1     Running   0          3m1s
pod/prometheus-server-6598cc45d8-dml7j                   2/2     Running   0          3m1s

NAME                                          TYPE        CLUSTER-IP       EXTERNAL-IP   PORT(S)    AGE
service/kubernetes                            ClusterIP   10.96.0.1        <none>        443/TCP    44d
service/prometheus-alertmanager               ClusterIP   10.107.99.89     <none>        9093/TCP   3m1s
service/prometheus-alertmanager-headless      ClusterIP   None             <none>        9093/TCP   3m1s
service/prometheus-kube-state-metrics         ClusterIP   10.109.76.187    <none>        8080/TCP   3m1s
service/prometheus-prometheus-node-exporter   ClusterIP   10.110.24.169    <none>        9100/TCP   3m1s
service/prometheus-prometheus-pushgateway     ClusterIP   10.106.182.146   <none>        9091/TCP   3m1s
service/prometheus-server                     ClusterIP   10.99.196.33     <none>        80/TCP     3m1s

NAME                                                 DESIRED   CURRENT   READY   UP-TO-DATE   AVAILABLE   NODE SELECTOR            AGE
daemonset.apps/prometheus-prometheus-node-exporter   1         1         1       1            1           kubernetes.io/os=linux   3m1s

NAME                                                READY   UP-TO-DATE   AVAILABLE   AGE
deployment.apps/prometheus-kube-state-metrics       1/1     1            1           3m1s
deployment.apps/prometheus-prometheus-pushgateway   1/1     1            1           3m1s
deployment.apps/prometheus-server                   1/1     1            1           3m1s

NAME                                                           DESIRED   CURRENT   READY   AGE
replicaset.apps/prometheus-kube-state-metrics-78d874fb59       1         1         1       3m1s
replicaset.apps/prometheus-prometheus-pushgateway-8647d94cf6   1         1         1       3m1s
replicaset.apps/prometheus-server-6598cc45d8                   1         1         1       3m1s

NAME                                       READY   AGE
statefulset.apps/prometheus-alertmanager   1/1     3m1s
As we can see, the Helm chart has deployed multiple pods and services for Prometheus to work.
Additionally, we can verify which Helm release is currently deployed.
helm list
NAME            NAMESPACE       REVISION        UPDATED                                 STATUS          CHART                   APP VERSION
prometheus      default         1               2024-03-03 21:55:58.075319 +0100 CET    deployed        prometheus-25.16.0      v2.50.1
Step 2: Analyze the Prometheus dashboard
Note that all the services are assigned a ClusterIP with the port number. To access the Prometheus dashboard, we are interested in the “prometheus-server” service. However, we cannot access it since it is not forwarded on localhost.
To access the Prometheus dashboard, start by running the command below. This is also indicated in the output of the “helm install” command.
kubectl port-forward prometheus-server-6598cc45d8-dml7j 9090Read also: How to Use Kubectl Port-forward in Kubernetes Applications
The output:
Forwarding from 127.0.0.1:9090 -> 9090
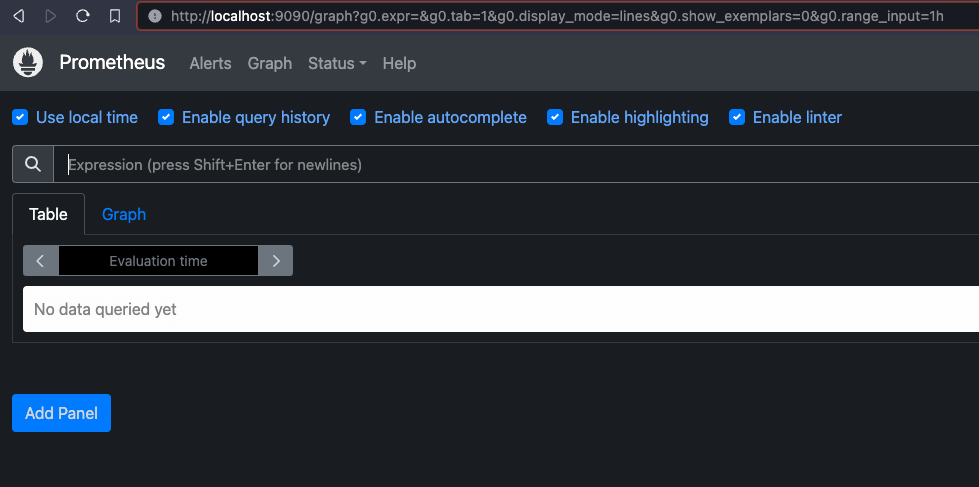
Forwarding from [::1]:9090 -> 9090Now, open http://localhost:9090/graph in the browser. It should show the Prometheus dashboard, as shown below.
Navigate to Status > Targets, and we should see below targets registered:
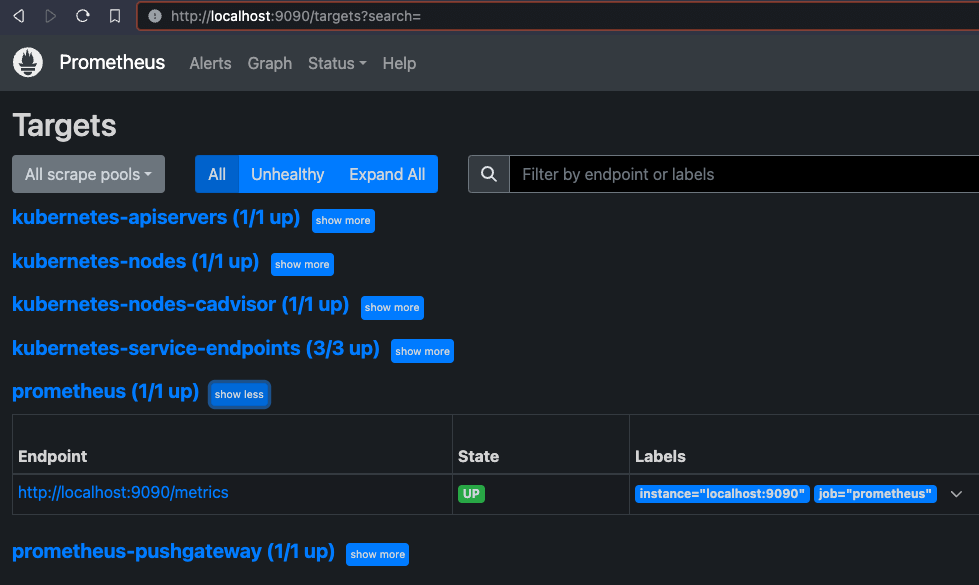
When Prometheus is installed using the prometheus-community Helm chart, it deploys Prometheus components and registers the same as targets.
As we can see from the screenshot above, it is monitoring K8s API server, Nodes, Push Gateway, and Service Endpoints. Changing the configuration file can modify this target registration, but we will do the same in the next step.
For now, we are interested in the “prometheus” target, which is currently monitoring the URL endpoint where we have the Prometheus dashboard running. The state is marked as “UP” and it also provides a few labels using which we can query the logs related to this.
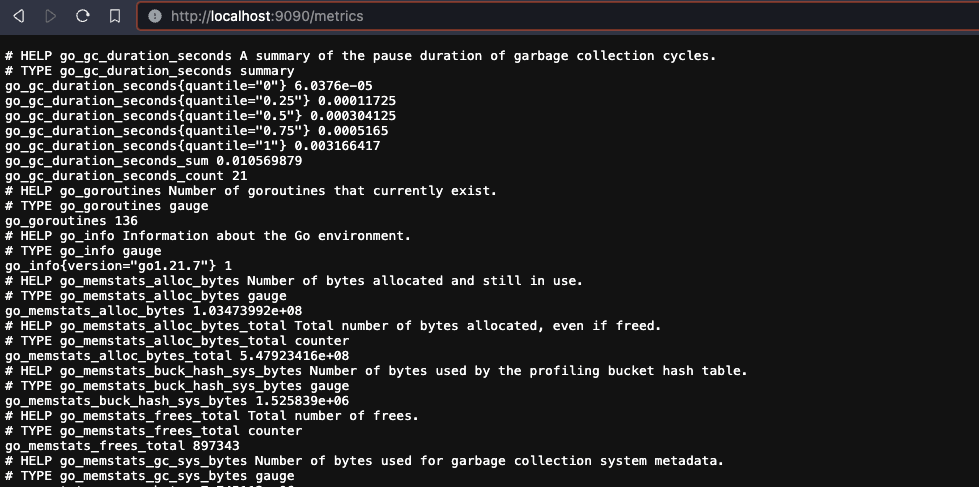
To double-check, open “http://localhost:9090/metrics” in a different browser. It will show all the events created by the service, as seen below:
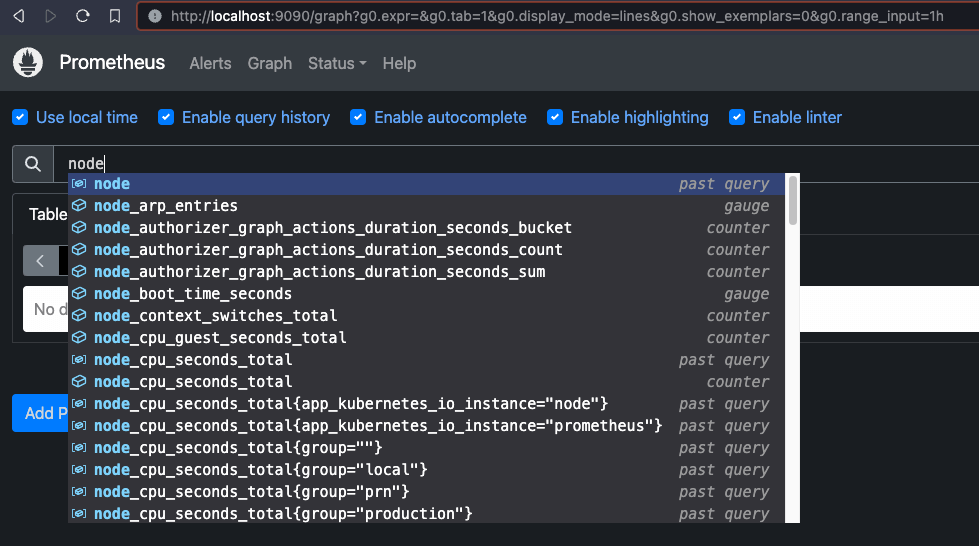
Navigate to the homepage and click on the “Table” tab. This view provides a search-type field where we are expected to input a PromQL expression that helps query the logs stored in time series format.
Prometheus captures many attributes in a log entry. This also depends on the type of “exporter” and the service exposing these logs. There is no definite answer to what attribute expressions are available for query, but if we start typing into the expression box, it should provide us with the list as seen below.
Let’s assume that we are interested in knowing more about the HTTP requests.
Select the “prometheus_http_requests_total” attribute for the query and click on execute. It will return all the logs that include this information.
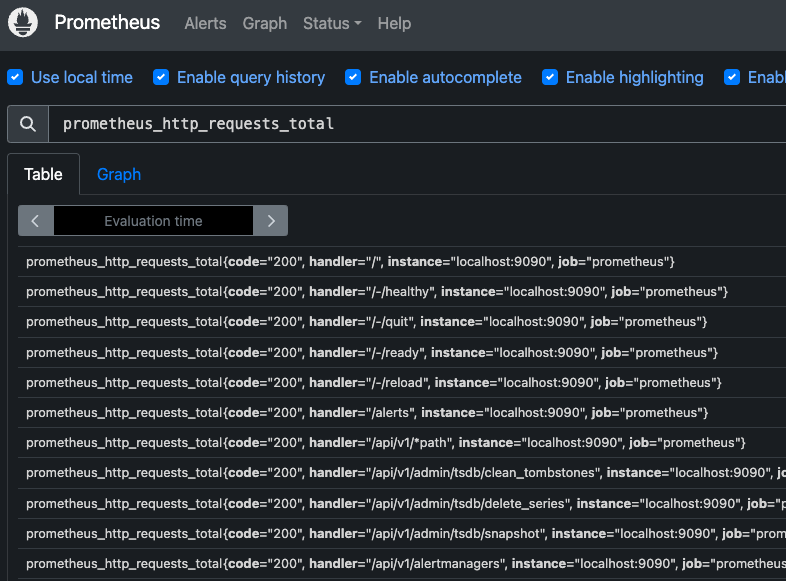
Notice how the searchable attributes are mentioned in the curly braces. We can use it to filter the results.
For example, to apply a query on “handler” attribute, we can choose to write the query expression as below.
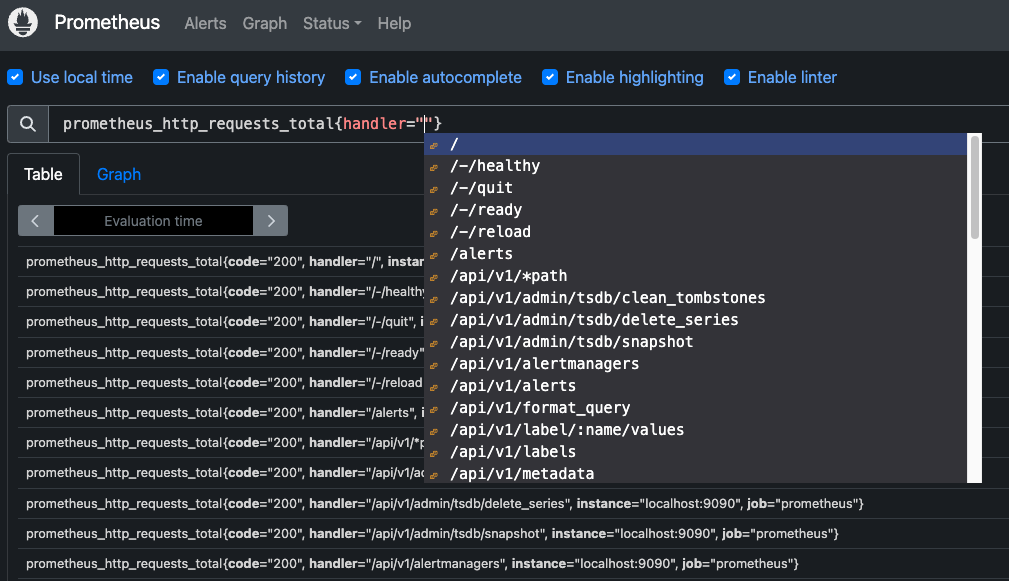
This is a very basic form of PromQL query, but it is possible to perform aggregate operations.
Step 3: Configure Prometheus deployment
In the previous step, we did not make use of the prometheus.yml file to customize or configure the Prometheus deployment on Kubernetes. To configure various Prometheus settings, we can serve the “value.yml” file to Helm while installing the prometheus-community chart. The best way to go forward in this case is to get the default values for the chart from the corresponding repository.
In the root directory of your project, create a file named “values.yml” or “prometheus.yml”. Paste and save the default values copied from the artifact repository. This makes it easy to change/remove/add the configuration. For example, if we don’t want to see all the targets monitored by default configuration, as shown in the second step, we can remove the same.
Note that this configuration YAML file contains a path that describes the contents of prometheus.yml in the same way we would write it otherwise without Helm. However, it also contains values for other Helm configurations.
To change the Prometheus configuration, scroll down to the serverFiles: path in this YAML file. The contents described in the prometheus.yml: path describe the contents of the YAML file fed to Prometheus.
We have a node_exporter running as a separate container outside of Kubernetes. The node_exporter Docker container services are exposed on port 8081. Verify this by checking the metrics from the browser, as seen below.
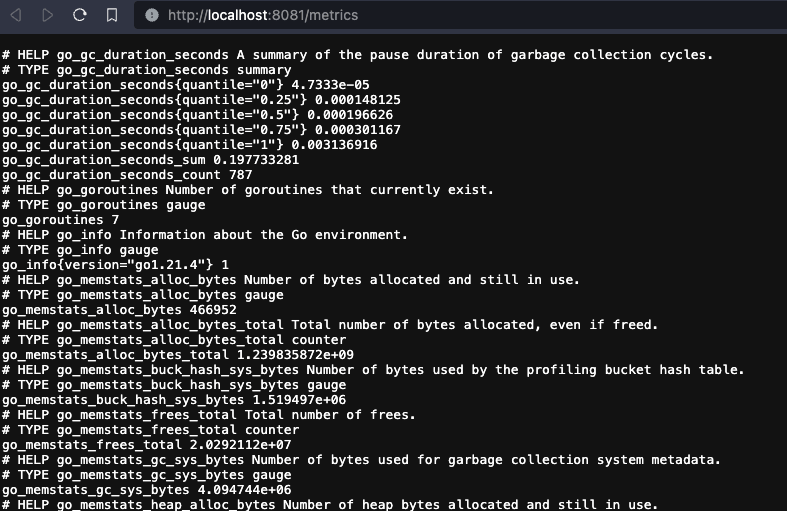
Let’s assume we now want to monitor the same using Prometheus deployed using Helm.
Add the following target in this path: serverFiles: prometheus.yml: > scrape_configs: > - job_name: prometheus
 scrape_configs:
     - job_name: prometheus
       static_configs:
         - targets: ['localhost:9090']
         - targets: ['docker.for.mac.localhost:8081']
The first target ‘localhost:9090’ is the default value provided. This is what was currently being registered as a “prometheus” target as we’ve seen in Step 2. We have added the new target “docker.for.mac.localhost:8081”, to monitor the independently running Docker container.
Check this document for more information if you are running on a different system.
To put it into action, uninstall the Helm chart:
helm uninstall prometheusInstall it again. This time, provide the configuration file as shown below.
helm install -f prometheus.yml prometheus prometheus-community/prometheusList the pods:
kubectl get pods
NAME                                                 READY   STATUS    RESTARTS   AGE
prometheus-alertmanager-0                            1/1     Running   0          13s
prometheus-kube-state-metrics-78d874fb59-jdz2q       1/1     Running   0          13s
prometheus-prometheus-node-exporter-wm74m            1/1     Running   0          13s
prometheus-prometheus-pushgateway-8647d94cf6-wl6qj   1/1     Running   0          13s
prometheus-server-6598cc45d8-7hll6                   1/2     Running   0          13s
Forward the server on port 9090:
kubectl port-forward prometheus-server-6598cc45d8-7hll6 9090
Forwarding from 127.0.0.1:9090 -> 9090
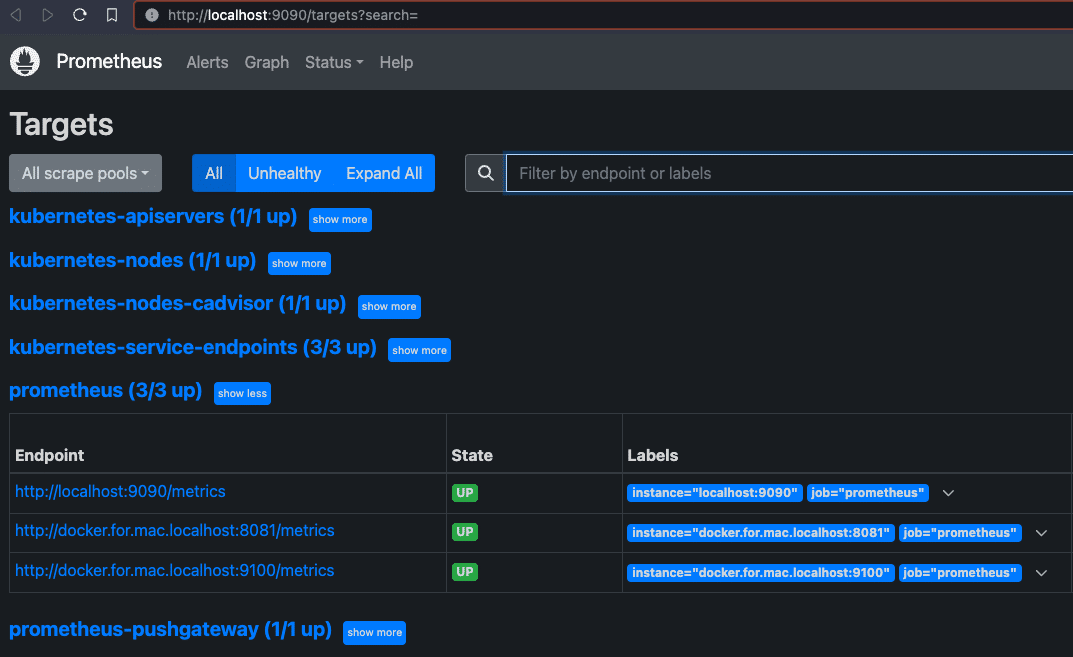
Forwarding from [::1]:9090 -> 9090Open the Prometheus dashboard and make sure the new target is being registered, as shown below.
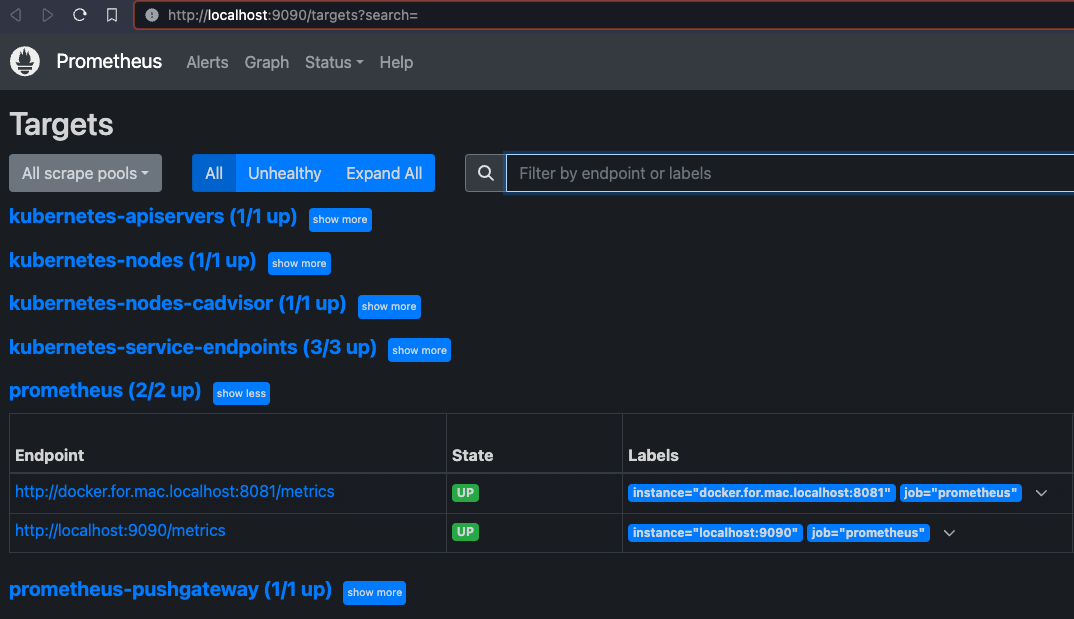
Thus, we are now able to query the metrics produced by independently running the node exporter Docker container.
Step 4: Collect logs from non-containerized services
Although Prometheus is running in the Kubernetes environment, its Push gateway is also capable of capturing metrics from non-containerized services. In this step, we will introduce a new instance of node exporter, this time running an executable file locally and exporting the metrics on a different port.
The procedure is the same. Update the prometheus.yml configuration by adding a new target as shown below.
   scrape_configs:
     - job_name: prometheus
       static_configs:
         - targets: ['localhost:9090']
         - targets: ['docker.for.mac.localhost:8081']
         - targets: ['docker.for.mac.localhost:9100']
Reinstall the Helm chart and forward the port so it is accessible in the browser. This time, when we check the targets on the Prometheus dashboard, we should be able to see the new target, as seen in the screenshot below.
Prometheus can provide critical and accurate insights about the applications and services deployed on K8s. We then installed Prometheus on the K8s environment using the Helm chart. We can also add a custom configuration to the prometheus.yml file via Helm charts to listen to various node exporter instances.
Check out also how to set up Prometheus monitoring for the Kubernetes cluster.
Do you need an even simpler way to manage CI/CD pipelines on Kubernetes? Check out how Spacelift can help you cut down complexity and automate your infrastructure. It’s even got a Prometheus exporter ready to deliver metrics from your Spacelift account to your Grafana dashboards and other tools! Learn more with our tutorial on Monitoring your Spacelift account via Prometheus.
Get started on your journey by creating a free trial account or booking a demo with our engineering team.
Manage Kubernetes Easier and Faster
Spacelift allows you to automate, audit, secure, and continuously deliver your infrastructure. It helps overcome common state management issues and adds several must-have features for infrastructure management.


![How to Deploy Helm Charts with Argo CD [Tutorial]](/_next/image?url=https%3A%2F%2Fspaceliftio.wpcomstaging.com%2Fwp-content%2Fuploads%2F2024%2F02%2F340.-argo-cd-with-helm.png&w=3840&q=75)