
At Spacelift, we use PostgreSQL (specifically Aurora Serverless) for most of our primary database needs. Our application query patterns are mostly small transactions that touch a few rows – a typical scenario that PostgreSQL handles without breaking a sweat.
We also use Datadog as a monitoring solution. Their agent has a handy feature to create metrics based on periodically executed SQL queries, allowing us to build smart and highly contextual monitors and alerts. Occasionally, such queries might be slow and dominate the processing time of the database. After hooking up Datadog Database monitoring, we identified a lot of slow queries and moved most of them to a separate Redshift cluster. There they execute once per day on a periodic snapshot of the database.
However, a number of these queries need to happen at a more frequent interval as they can detect alertable conditions. We couldn’t move these queries to Redshift because of the staleness of the data there. Aurora Serverless also doesn’t support read replicas to offload analytical queries to them, so no luck there either. Thus, we had to optimize, add indices, optimize, and again optimize until we cut the database usage of these metric-creating queries by 1-2 orders of magnitude.
This article will show you one such optimization story, which is interesting because both the before and after query plans will look somewhat ridiculous (in terms of cost). Moreover, it shows how PostgreSQL row count estimation can go very wrong. In this case, domain knowledge will help us trick PostgreSQL into a different query plan which will be waaay faster, without adding any additional indices.
Spacelift is a CI/CD platform specializing in Infrastructure as Code. Users create Runs (executions of, i.e., Terraform) which will be executed on Worker Pools. There is a public shared Worker Pool managed by Spacelift and private Worker Pools that users can host for themselves.
Each Run belongs to a Stack, which can be thought of as a single environment, managing a bunch of infrastructure resources. If you know Terraform or CloudFormation, a single Stack maps to a single Terraform state file or a CloudFormation root stack, respectively.
A Run can have one of many types: Tracked, Proposed, and others. That type determines what the overall workflow will look like.
The query is supposed to notify us when the public Worker Pool cannot handle demand – user Runs are waiting too long to be handled by a Worker.
SELECT COUNT(*)                                                                  as "count",
       COALESCE(MAX(EXTRACT(EPOCH FROM age(now(), runs.created_at)))::bigint, 0) AS "max_age"
FROM runs
  JOIN stacks ON runs.stack_id = stacks.id
  JOIN worker_pools ON worker_pools.id = stacks.worker_pool_id
  JOIN accounts ON stacks.account_id = accounts.id
WHERE worker_pools.is_public = true
  AND runs.type IN (1, 4)
  AND runs.state = 1
  AND runs.worker_id IS NULL
  AND accounts.max_public_parallelism / 2 > (SELECT COUNT(*)
                                             FROM accounts accounts_other
                                               JOIN stacks stacks_other ON accounts_other.id = stacks_other.account_id
                                               JOIN runs runs_other ON stacks_other.id = runs_other.stack_id
                                             WHERE accounts_other.id = accounts.id
                                               AND (stacks_other.worker_pool_id IS NULL OR
                                                    stacks_other.worker_pool_id = worker_pools.id)
                                               AND runs_other.worker_id IS NOT NULL)
That’s a big query! What’s happening here?
We’re interested in the number of Runs (as well as the age of the oldest one) which are of the Proposed or Testing type (can be scheduled right away – other Run types require exclusiveness), are in the Queued state (which means they’re not yet being processed) and don’t have a Worker attached to them (are still waiting for one).
We only want Runs on Accounts that are far from their parallelism limit to reduce the number of false positives caused by users being correctly limited. So for each Run, we count the number of active Runs on its account and check if it’s under 50% of the parallelism limit, and only then do we count this Run as properly pending.
Unfortunately, that query lasts 20 seconds and consumes 50% of our database’s processing time. That’s pretty bad.
Let’s take a look at the query plan. I’ll be using https://explain.dalibo.com to visualize query plans. To get the query plan, I’m executing it prefixed with EXPLAIN (FORMAT JSON, ANALYZE) … so we can also see information about the query’s actual execution (ANALYZE).
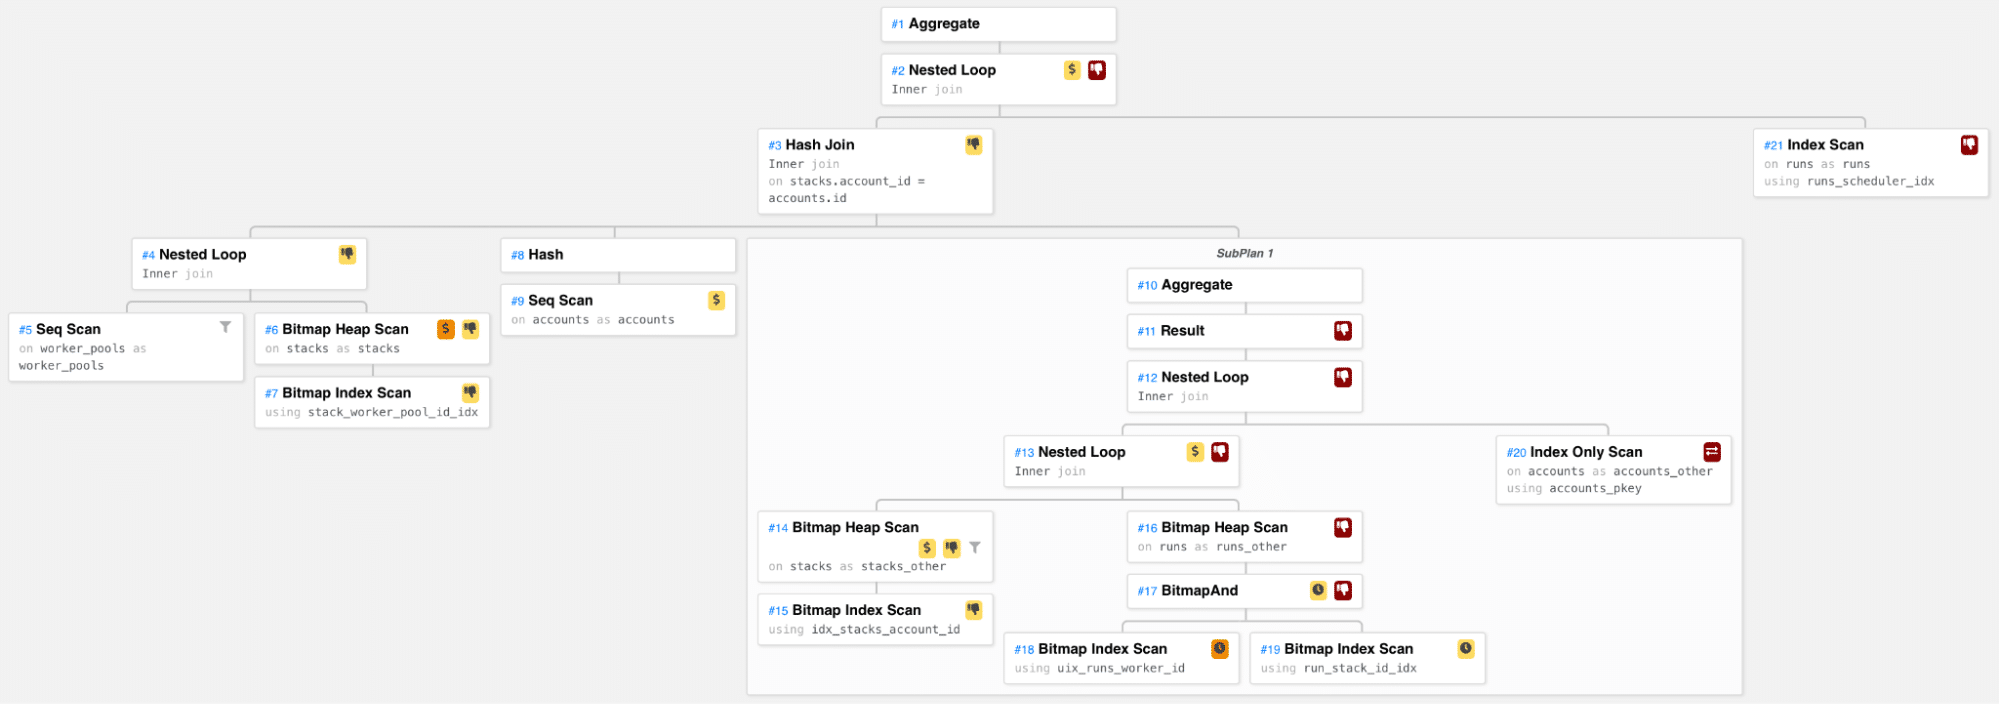
What can we see here?
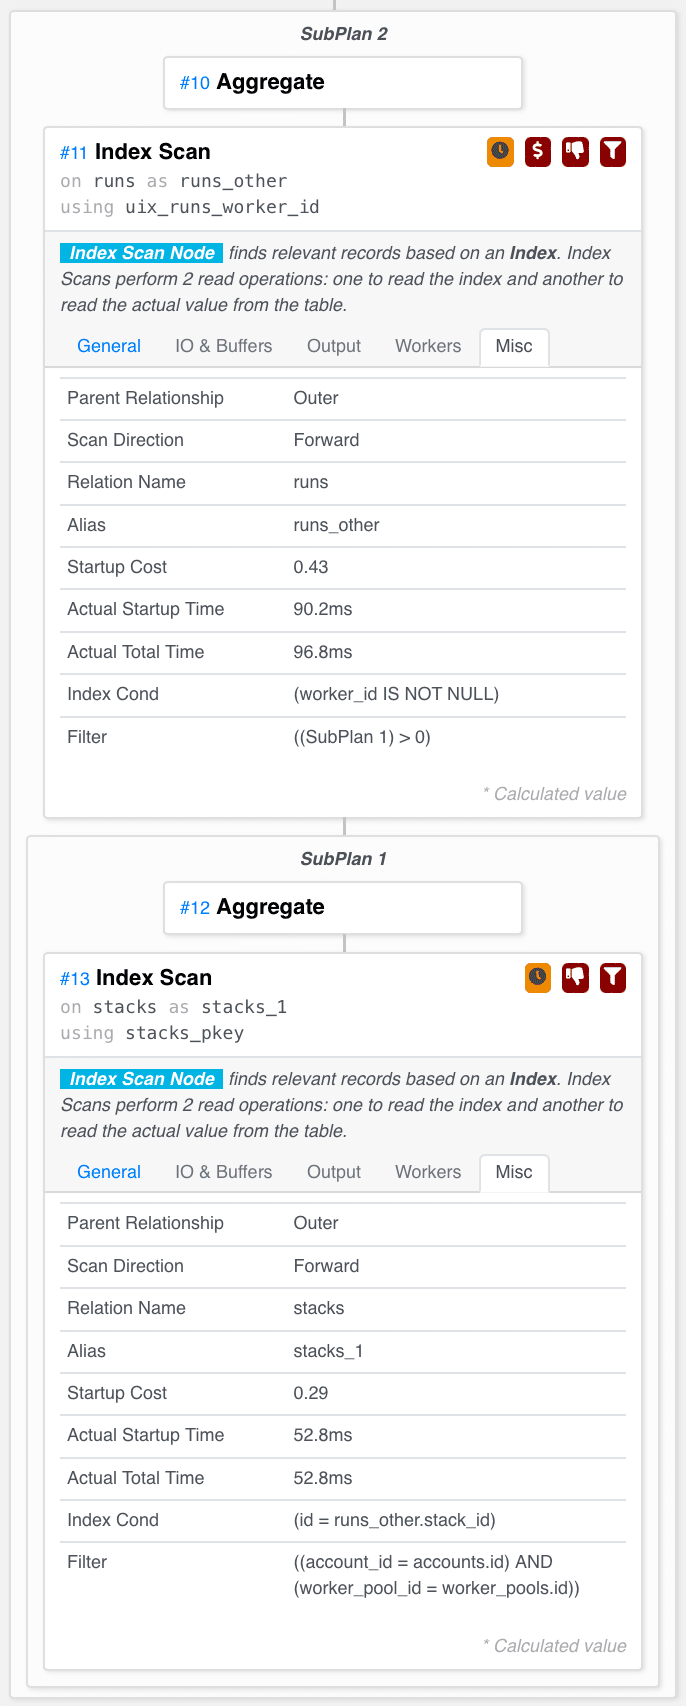
On the left side, we’re joining Worker Pools with Stacks. We also calculate the number of active Runs for each Account using the SubPlan. We do a three-way hash join on the (Worker Pool, Stack) tuples, the Accounts, and the SubPlan results based on the Account ID. Then we loop over all those triples and get the pending Runs for each, finally counting all the pending Runs found.
The SubPlan goes over all Stacks in an Account, and for each Stack gets the active Runs for it (the ones where worker_id is not NULL).
Let’s look at the time distribution of the plan nodes.
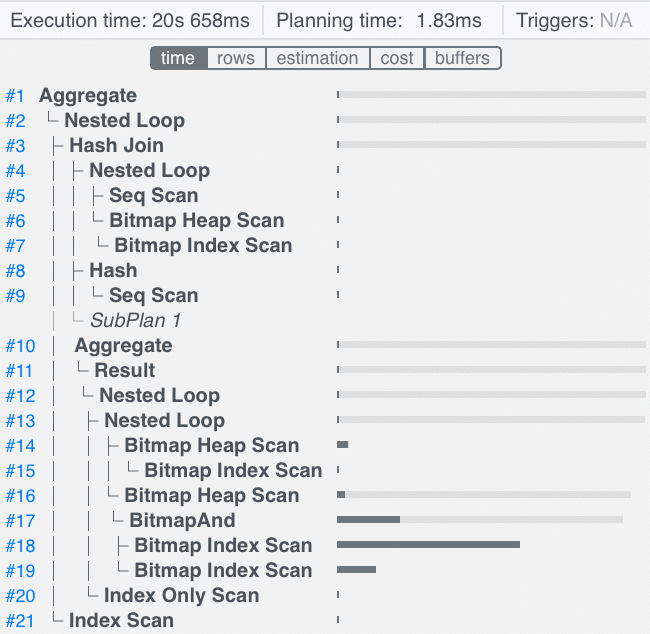
We can see that the most expensive part of this query is the Bitmap Index Scan which looks for Runs whose worker_id is not NULL, so let’s take a closer look at that part of the query plan.
For each Stack in the SubPlan, we look for active Runs on it. How do we do that?
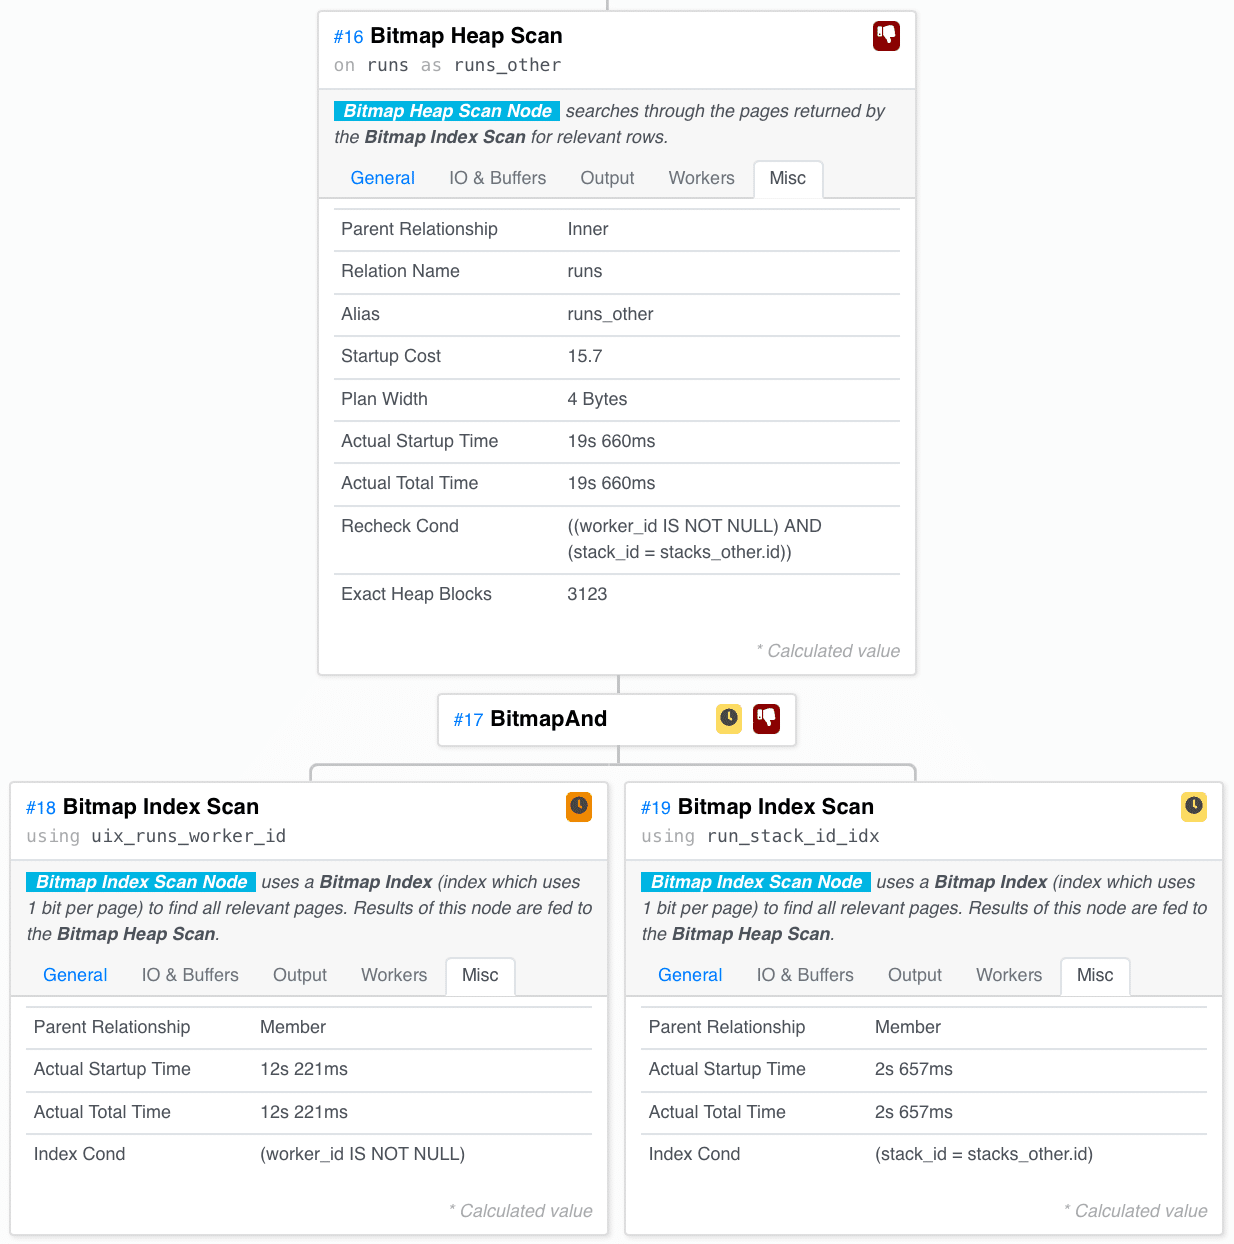
We scan the runs_worker_id index for storage pages containing Runs with a non-empty worker_id and the run_stack_id index for the pages containing Runs for the current Stack. Then we AND these together – we only want pages present in both of these scans. Finally, we scan the actual Runs from the pages and only take the ones that satisfy the predicates (pages found by the index may contain both relevant and irrelevant Runs).
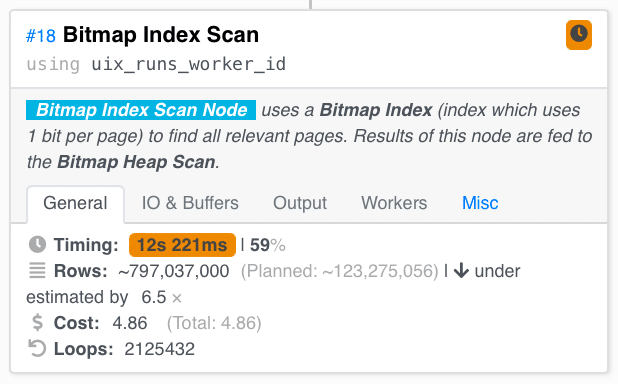
In a different tab of the left Index Scan, we can see the root of the problem. We made 531358 loops over this, and we expected to scan 120 mil Runs over the whole processing of the query here, but we scanned 800 mils. That’s much more.
But later in the Heap Scan of the ANDed pages, we see a gross overestimation.
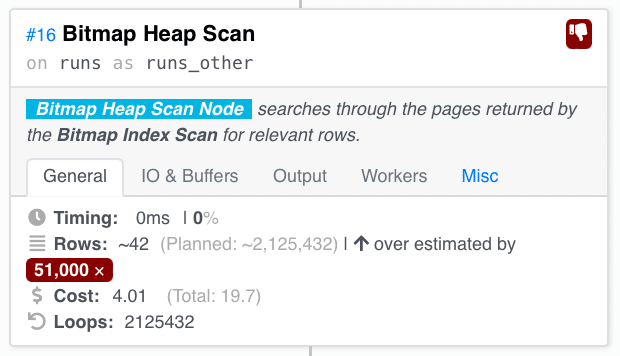
We expected to scan 2 mil rows but scanned 42 overall, which means no Runs were executing on most Stacks at this instant.
Overall, it’s mostly this subquery being very expensive:
SELECT COUNT(*)
FROM accounts accounts_other
  JOIN stacks stacks_other ON accounts_other.id = stacks_other.account_id
  JOIN runs runs_other ON stacks_other.id = runs_other.stack_id
WHERE accounts_other.id = accounts.id
  AND (stacks_other.worker_pool_id IS NULL OR
       stacks_other.worker_pool_id = worker_pools.id)
  AND runs_other.worker_id IS NOT NULL
Now comes the domain knowledge. Is there something we know the optimizer seems not to…? Yes!
Only a minuscule part of the Runs in the database are active at any given time. Most Stacks stay dormant most of the time. Whenever a user makes a commit, only the affected Stacks will execute Runs. There will obviously be Stacks that are constantly in use, but most won’t. Moreover, intensive users will usually use private Worker Pools. The public shared Worker Pool is predominantly utilized by smaller users, so that’s another reason for not seeing many Runs here.
Right now, we’re iterating over all existing Stacks attached to the public worker pool and getting relevant Runs for each. How about we flipped that? We know there are at most as many active Runs as there are public Workers – orders of magnitude fewer than there are Stacks. Overall active Runs (not just the ones on the public Worker Pool) are also way less numerous, at most as many as there are Workers overall (and since the number of private Workers is the main dimension we currently base our Enterprise tier pricing on, query processing time being linearly correlated with the number of Workers is OK). Thus, we could get all active Runs and filter to just those whose Stack uses the public Worker Pool.
The only problem is, we’re working with a fairly opaque query optimizer, and PostgreSQL doesn’t have any way to give hints to it – like forcing a join strategy. So we’ll have to do that differently. We’ll create a query that scans the active Runs and then uses another subquery to filter them to just the ones related to a relevant Stack. Then we’ll have to hope the query is opaque enough for Postgres not to get too clever with it.
SELECT COUNT(*)
FROM runs runs_other
WHERE (SELECT COUNT(*)
      FROM stacks
      WHERE stacks.id = runs_other.stack_id
        AND stacks.account_id = accounts.id
        AND stacks.worker_pool_id = worker_pools.id) > 0
 AND runs_other.worker_id IS NOT NULL
This query does exactly what we described. Scan active Runs, filter to just those with more than 0 Stacks in the current account and connected to the public Worker Pool. There would be either 1 or 0 such Stacks for each Run.
Executing this query, we get down to 100ms instead of the original 20s. That’s a vast improvement. What does the query plan say? (apologies for the long vertical picture)
Exactly what we wanted! It scans active Runs, and for each of them, checks (using a primary key index lookup – fast!) whether the Stack it belongs to is relevant.
That’s it! The whole optimized query now looks like this:
SELECT COUNT(*)                                                                  as "count",
       COALESCE(MAX(EXTRACT(EPOCH FROM age(now(), runs.created_at)))::bigint, 0) AS "max_age"
FROM runs
  JOIN stacks ON runs.stack_id = stacks.id
  JOIN worker_pools ON worker_pools.id = stacks.worker_pool_id
  JOIN accounts ON stacks.account_id = accounts.id
WHERE worker_pools.is_public = true
  AND runs.type IN (1, 4)
  AND runs.state = 1
  AND runs.worker_id IS NULL
  AND accounts.max_public_parallelism / 2 > (SELECT COUNT(*)
                                             FROM runs runs_other
                                             WHERE (SELECT COUNT(*)
                                                    FROM stacks
                                                    WHERE stacks.id = runs_other.stack_id
                                                      AND stacks.account_id = accounts.id
                                                      AND stacks.worker_pool_id = worker_pools.id) > 0
AND runs_other.worker_id IS NOT NULL)Thanks for reading! The moral of this story is that query plans aren’t that hard to interpret with the right tools. Using your domain knowledge, you can rewrite your queries to achieve substantial performance boosts without adding unnecessary indices or denormalizing the data model.
The most Flexible CI/CD Automation Tool
Spacelift is an alternative to using homegrown solutions on top of a generic CI. It helps overcome common state management issues and adds several must-have capabilities for infrastructure management.